Themes Overview
ggpop ships with three built-in themes, all optimized for icon-based charts:
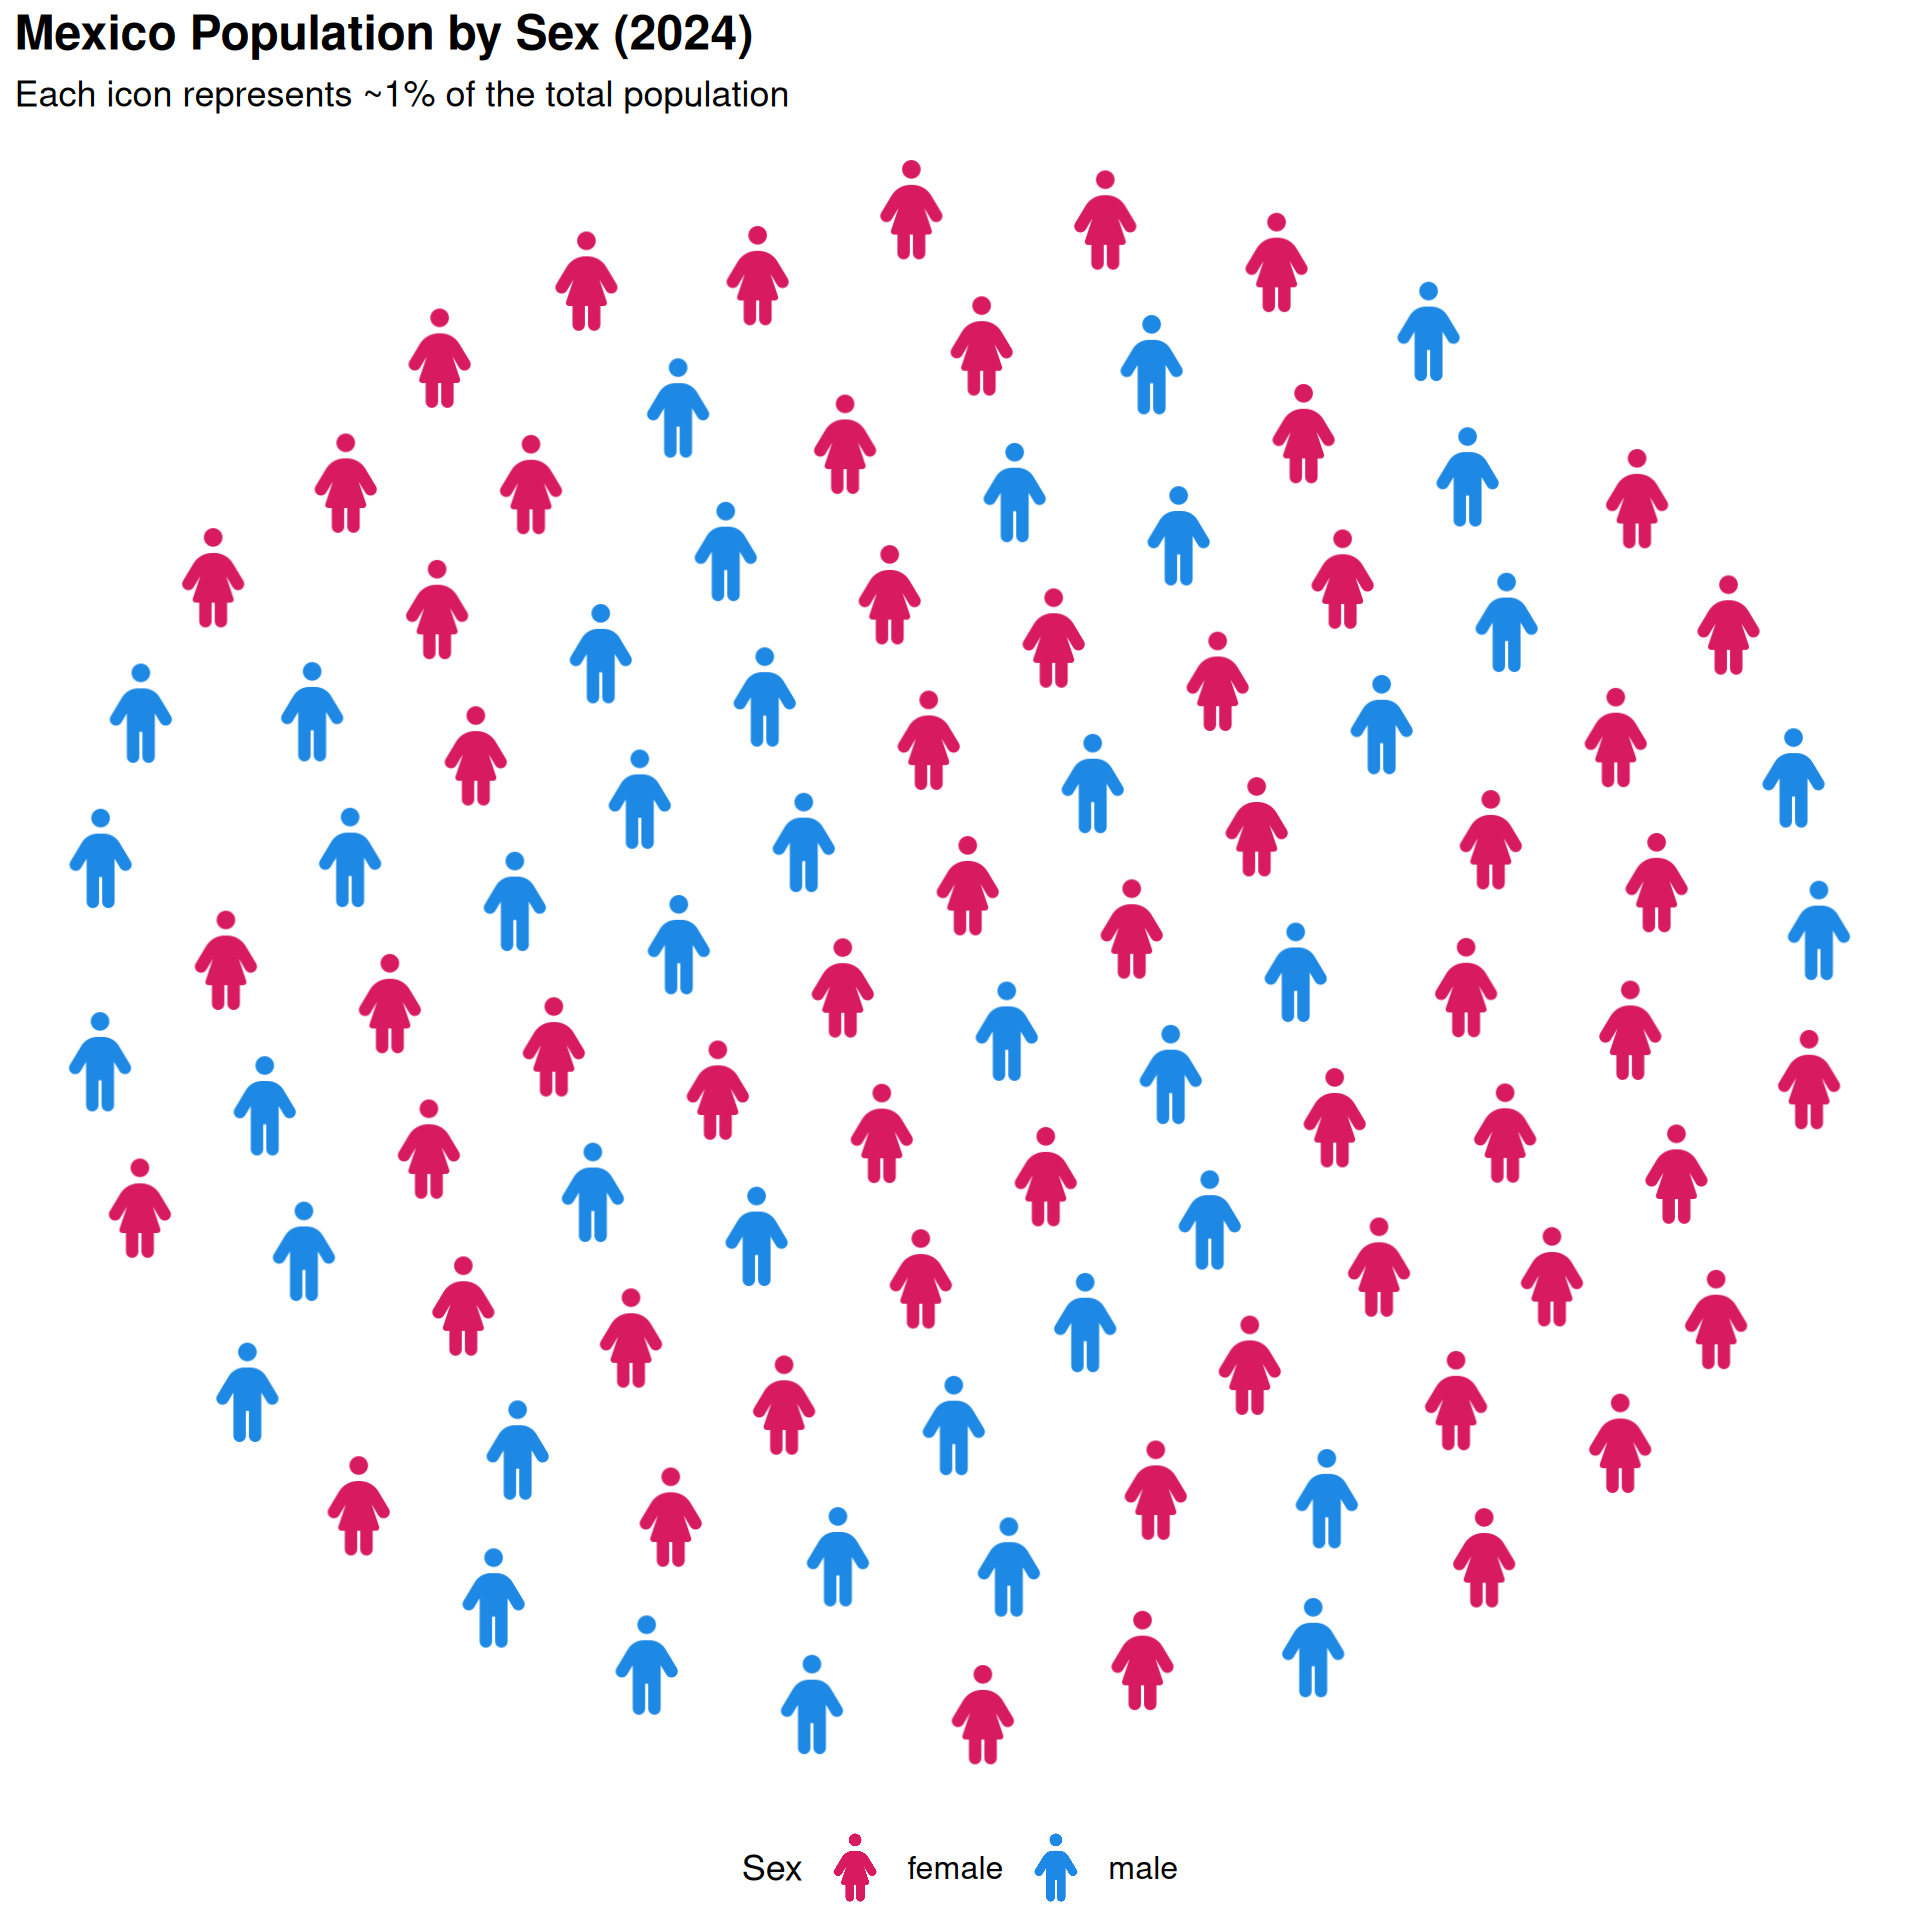
theme_pop()
Default theme — removes axes and gridlines. Layer standard theme() calls on top to customize.
ggplot() +
  geom_pop(
    data         = df_sex_proc,
    aes(icon = icon, color = type),
    size         = 2,
    dpi          = 100,
    legend_icons = TRUE
  ) +
  scale_color_manual(values = c("male" = "#1E88E5", "female" = "#D81B60")) +
  theme_pop(base_size = 15) +
  theme(legend.position = "bottom") +
  scale_legend_icon(size = 5) +
  labs(
    title    = "Mexico Population by Sex (2024)",
    subtitle = "Each icon represents ~1% of the total population",
    color    = "Sex"
  )
Parameters
-
base_size: controls font size throughout (default: 11)
-
legend_position: "right", "bottom", "left", "top", or "none"
-
plot_margin: single number or margin() object
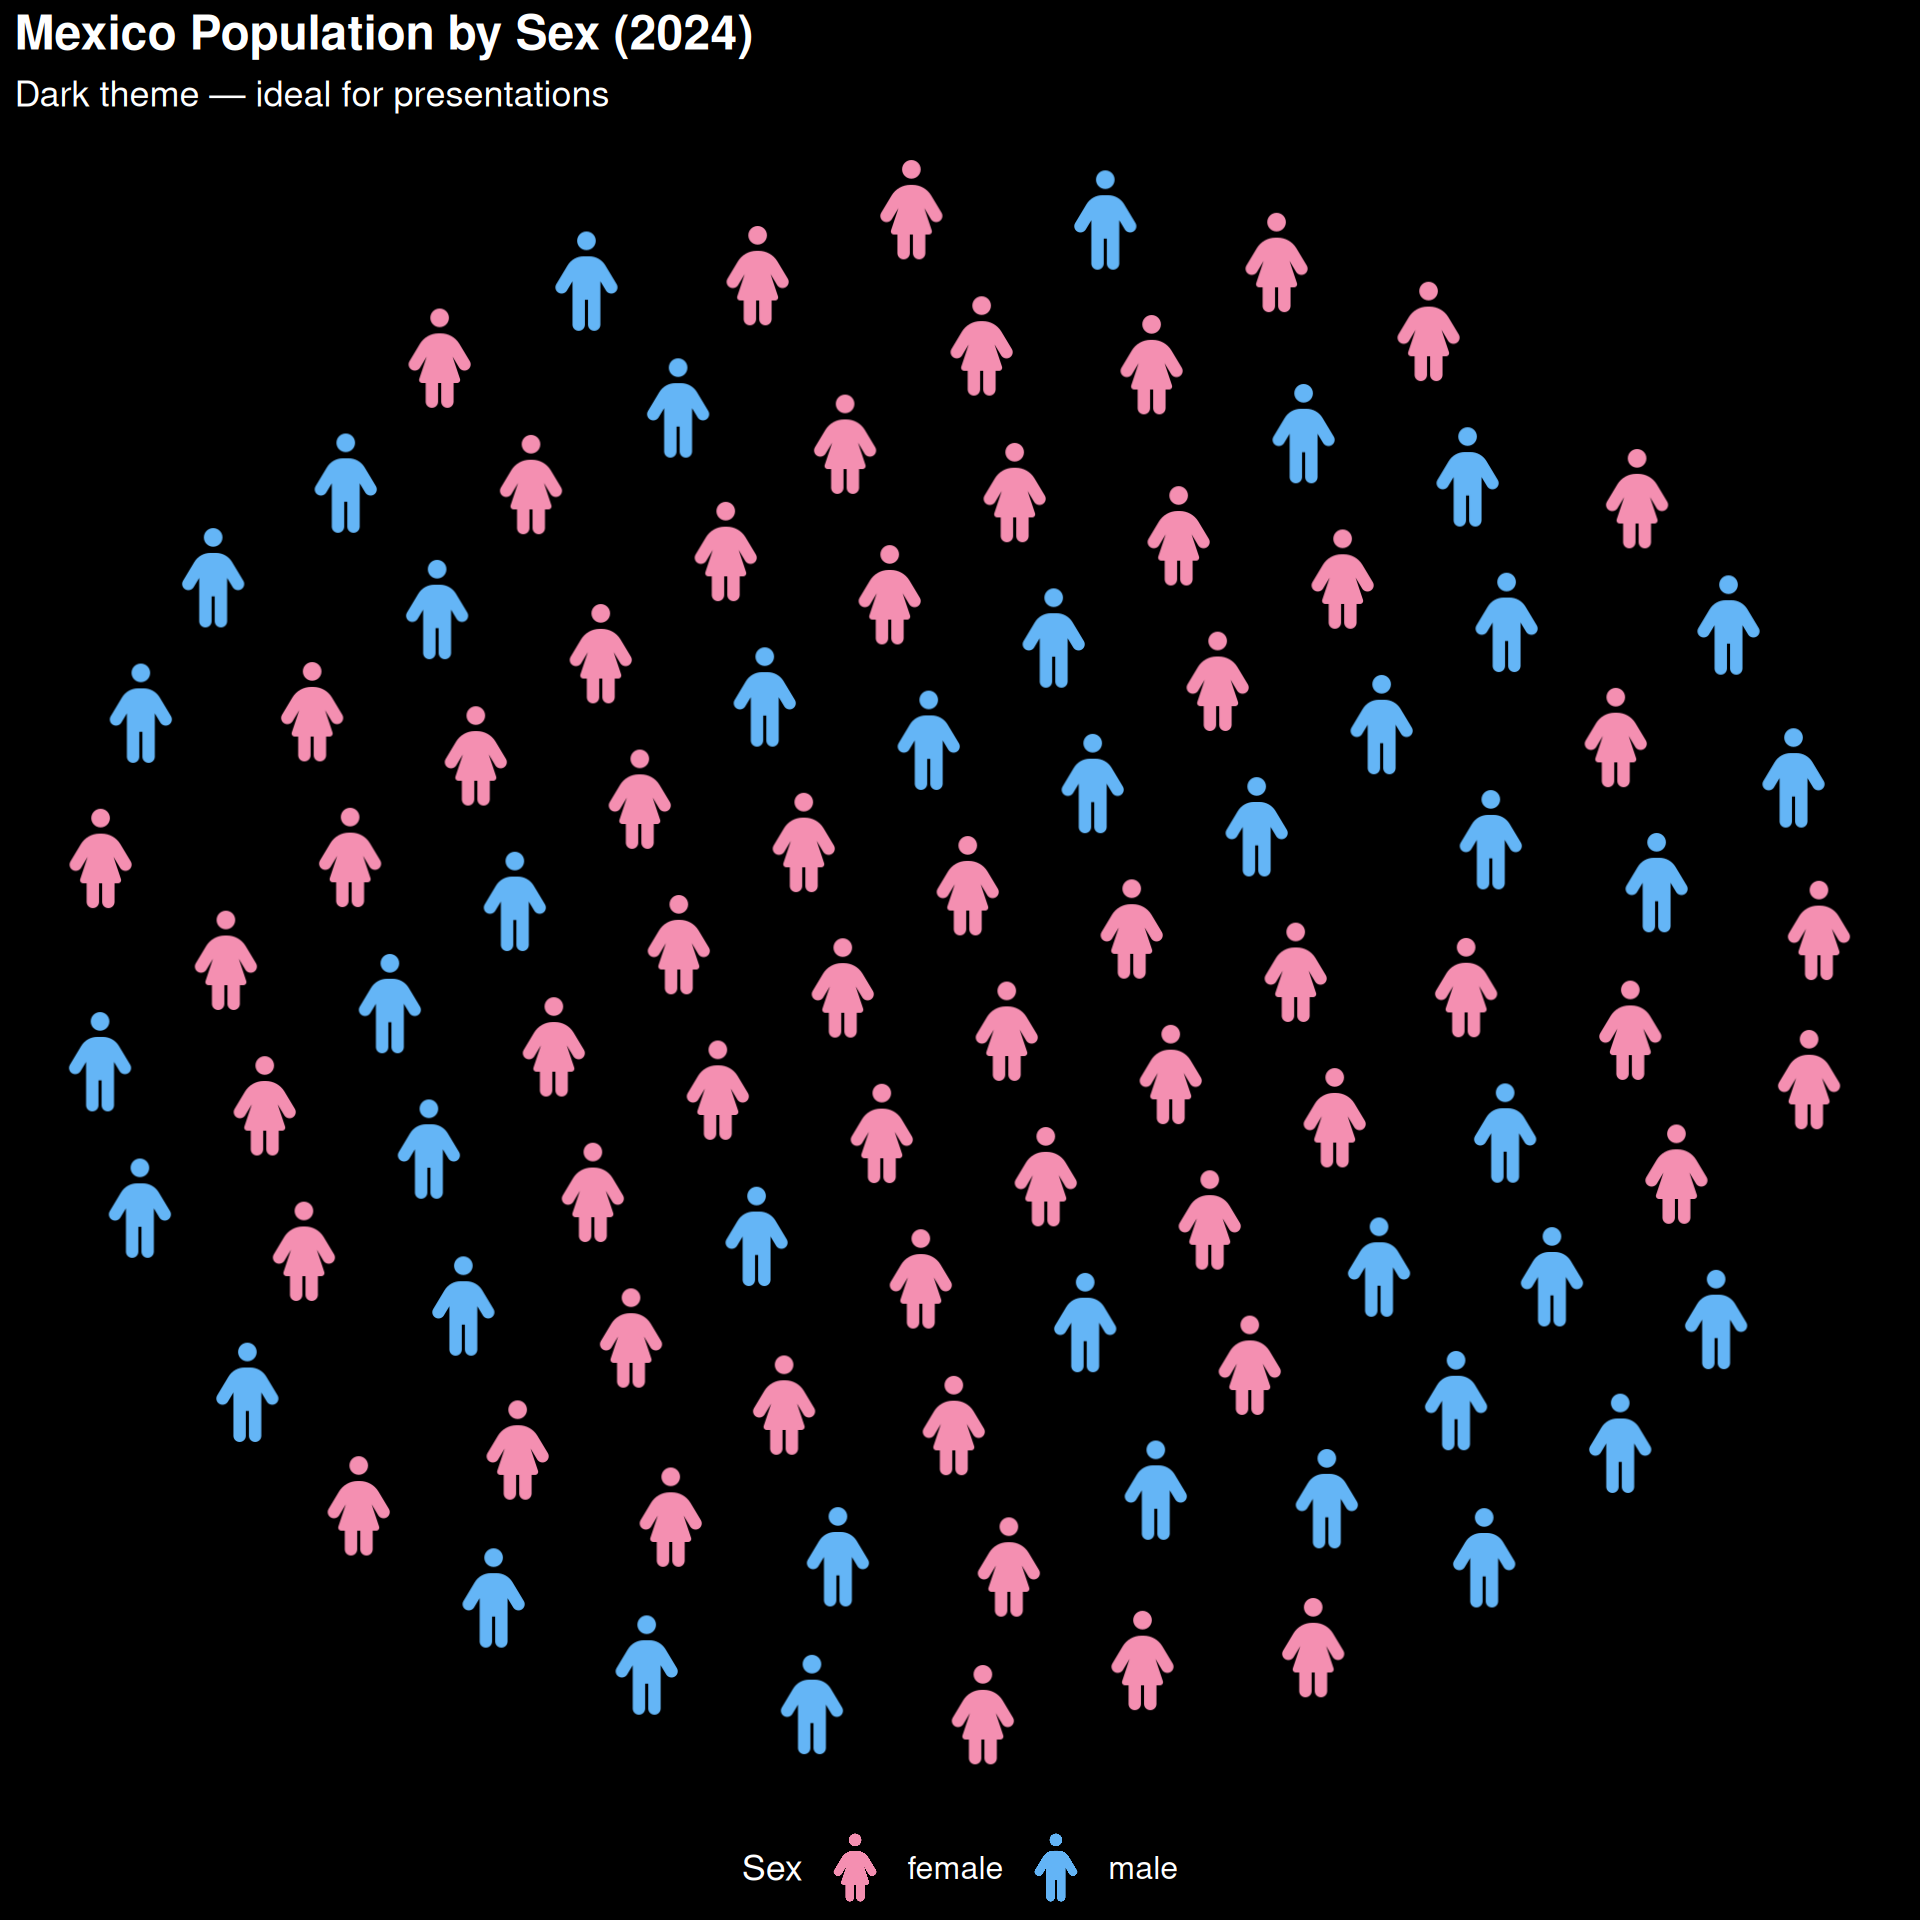
theme_pop_dark()
Dark variant of theme_pop() with bg_color and text_color parameters.
ggplot() +
  geom_pop(
    data         = df_sex_proc,
    aes(icon = icon, color = type),
    size         = 2,
    dpi          = 100,
    legend_icons = TRUE
  ) +
  scale_color_manual(values = c("male" = "#64B5F6", "female" = "#F48FB1")) +
  theme_pop_dark(base_size = 15) +
  theme(legend.position = "bottom") +
  scale_legend_icon(size = 5) +
  labs(
    title    = "Mexico Population by Sex (2024)",
    subtitle = "Dark theme — ideal for presentations",
    color    = "Sex"
  )
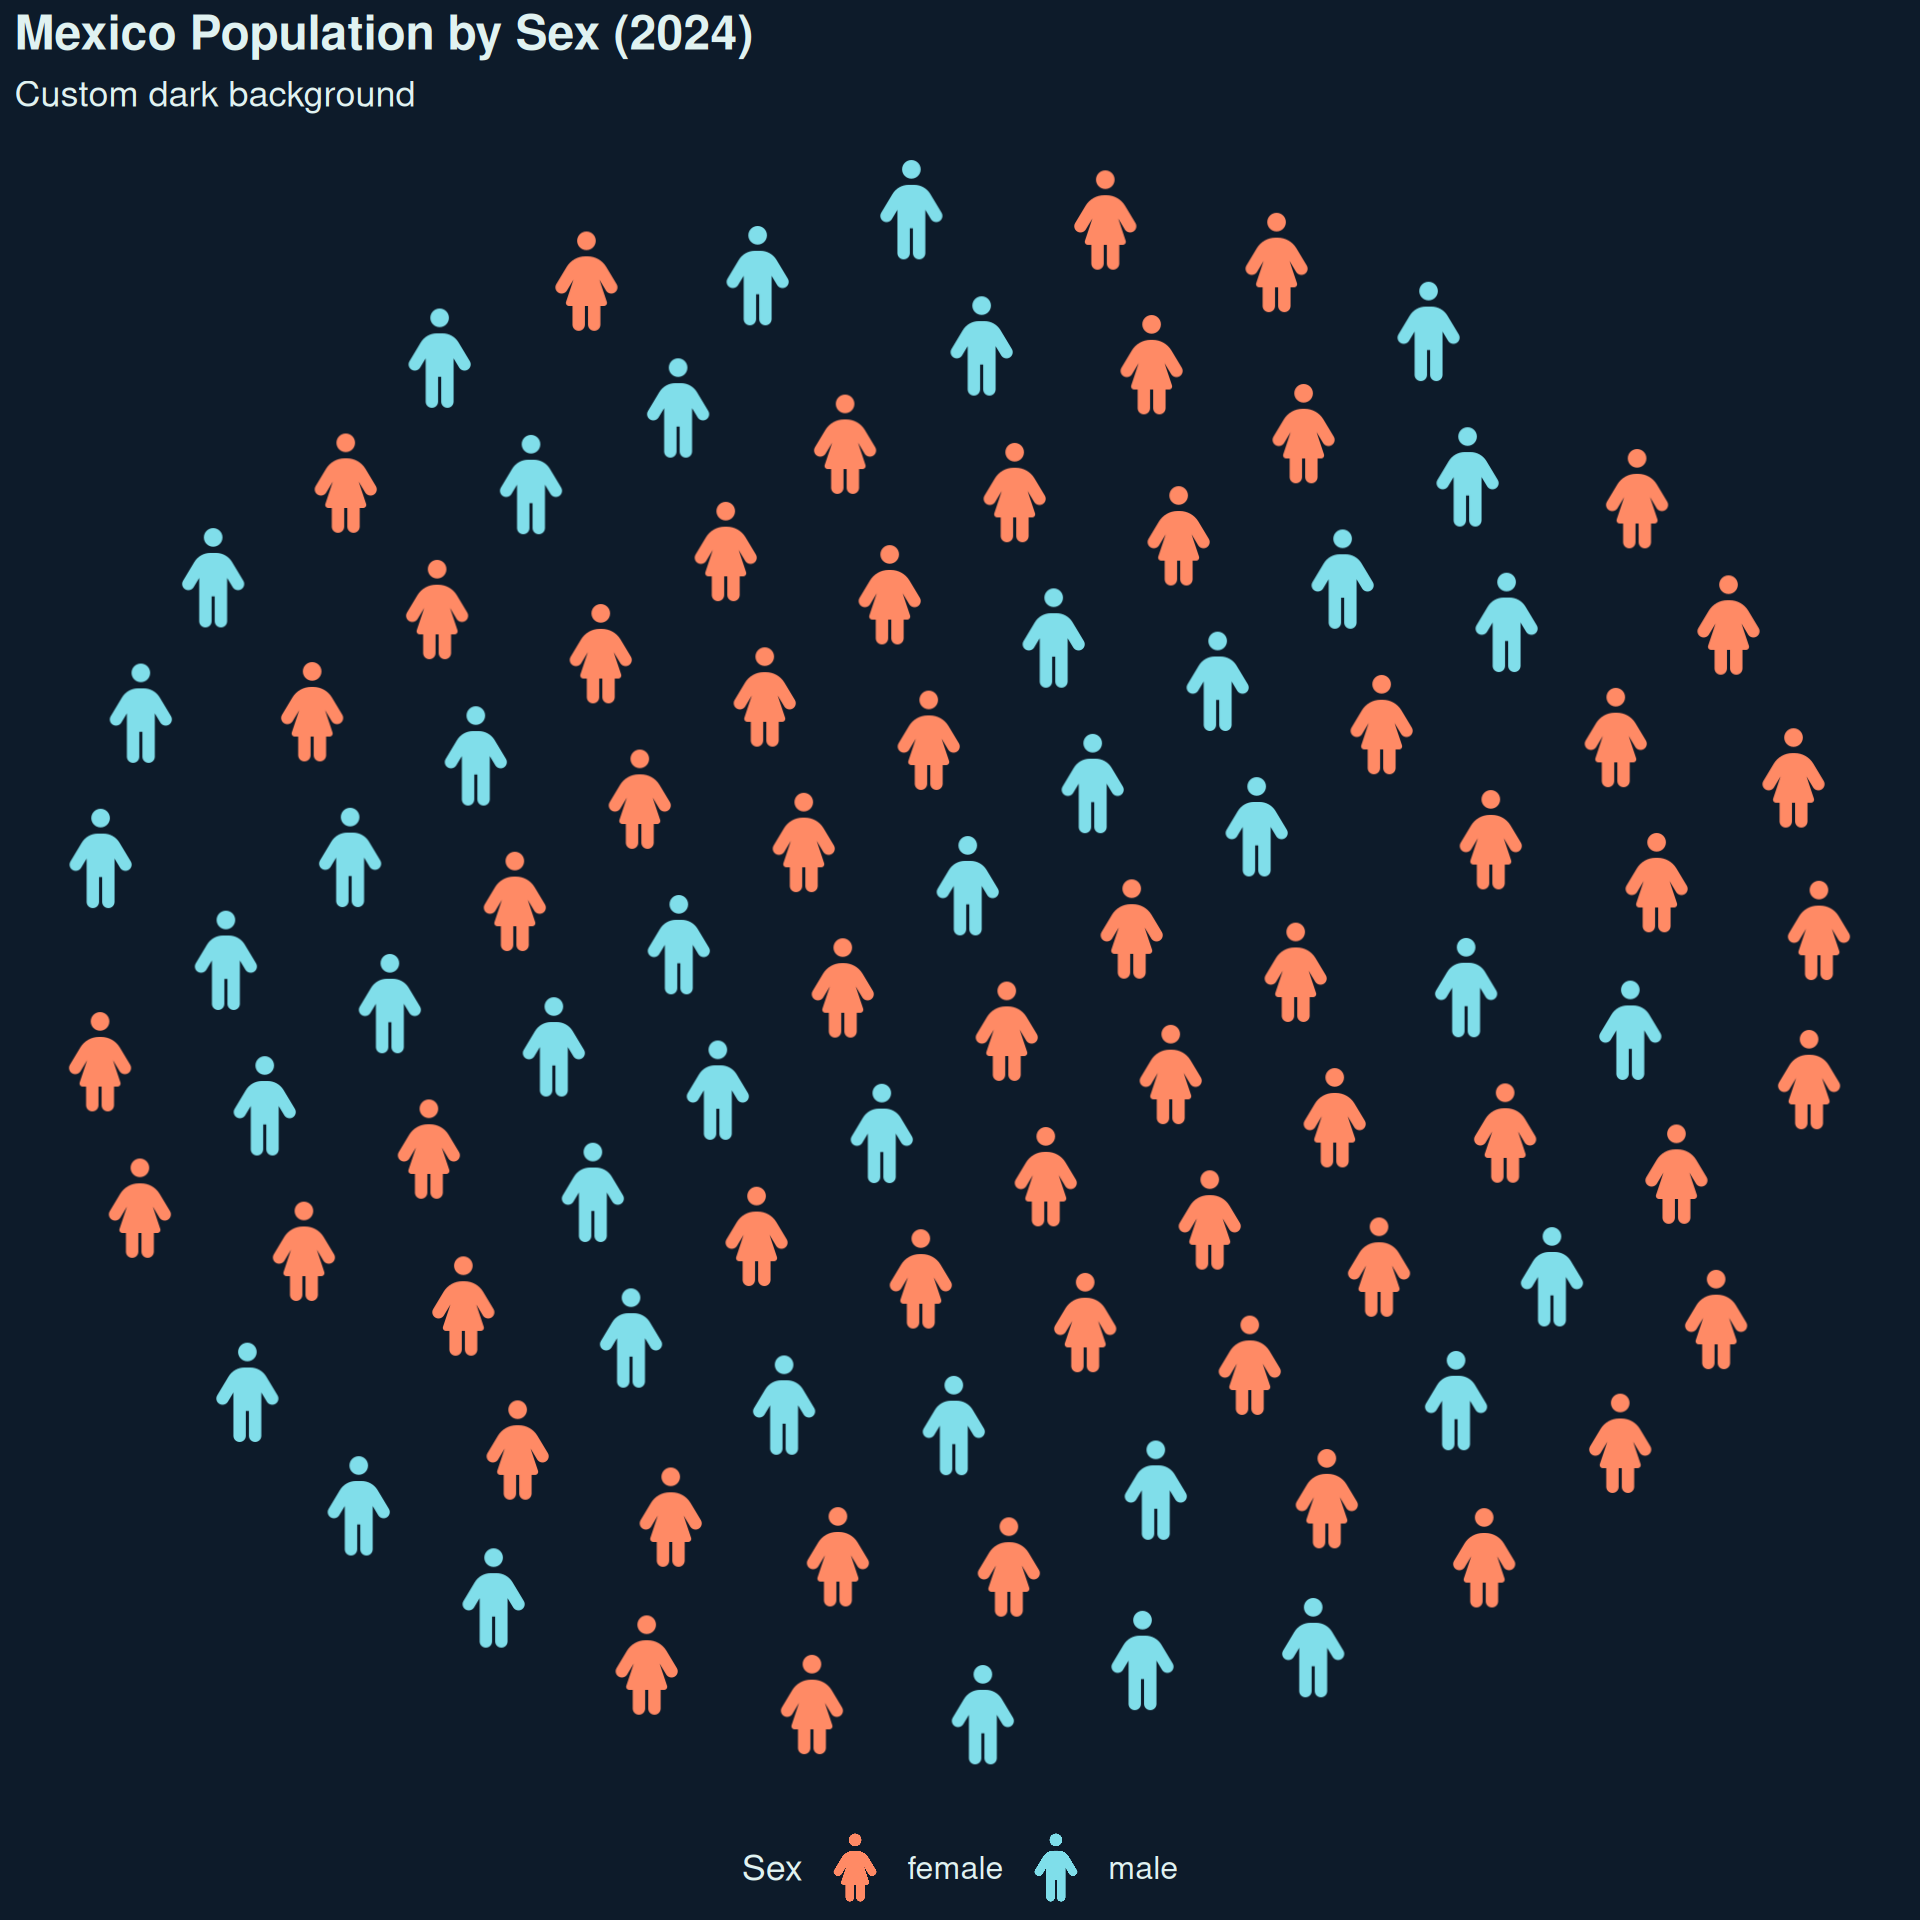
Custom background and text colors:
ggplot() +
  geom_pop(
    data         = df_sex_proc,
    aes(icon = icon, color = type),
    size         = 2,
    dpi          = 100,
    legend_icons = TRUE
  ) +
  scale_color_manual(values = c("male" = "#80DEEA", "female" = "#FF8A65")) +
  theme_pop_dark(base_size = 15, bg_color = "#0D1B2A", text_color = "#E0F2F1") +
  theme(legend.position = "bottom") +
  scale_legend_icon(size = 5) +
  labs(
    title    = "Mexico Population by Sex (2024)",
    subtitle = "Custom dark background",
    color    = "Sex"
  )
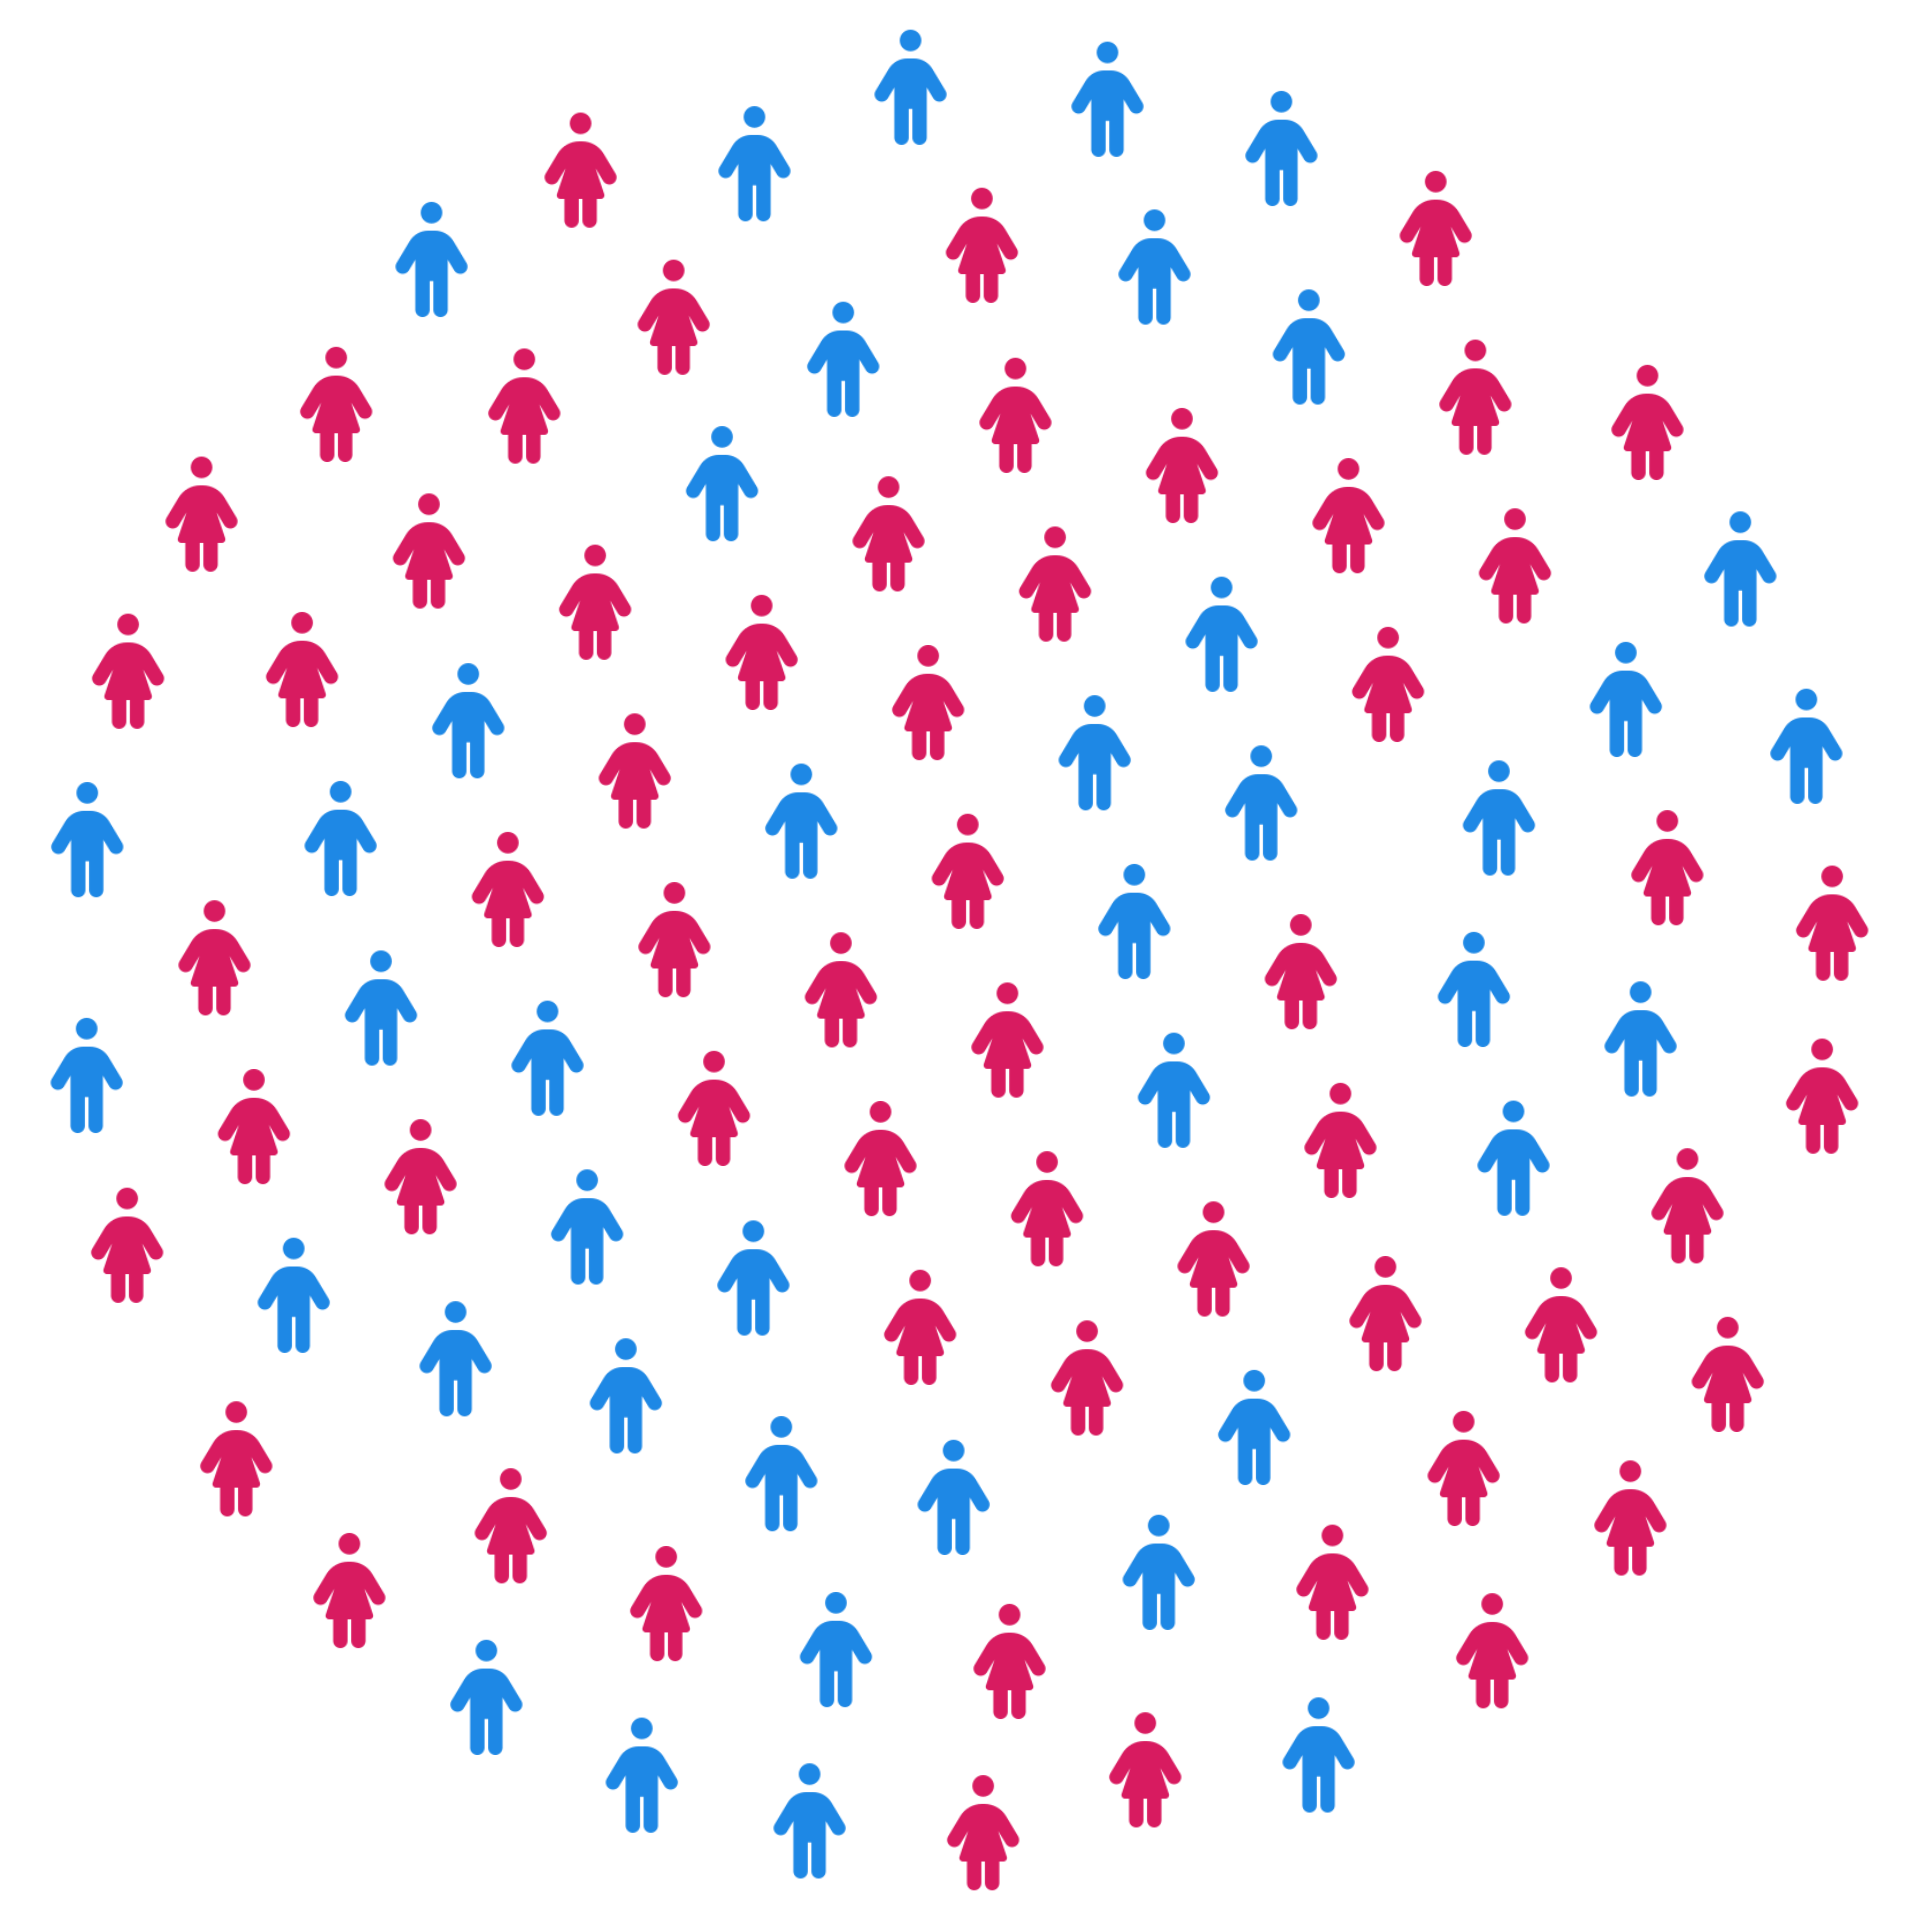
theme_pop_minimal()
No title, legend, or margins. Best for embedding in dashboards.
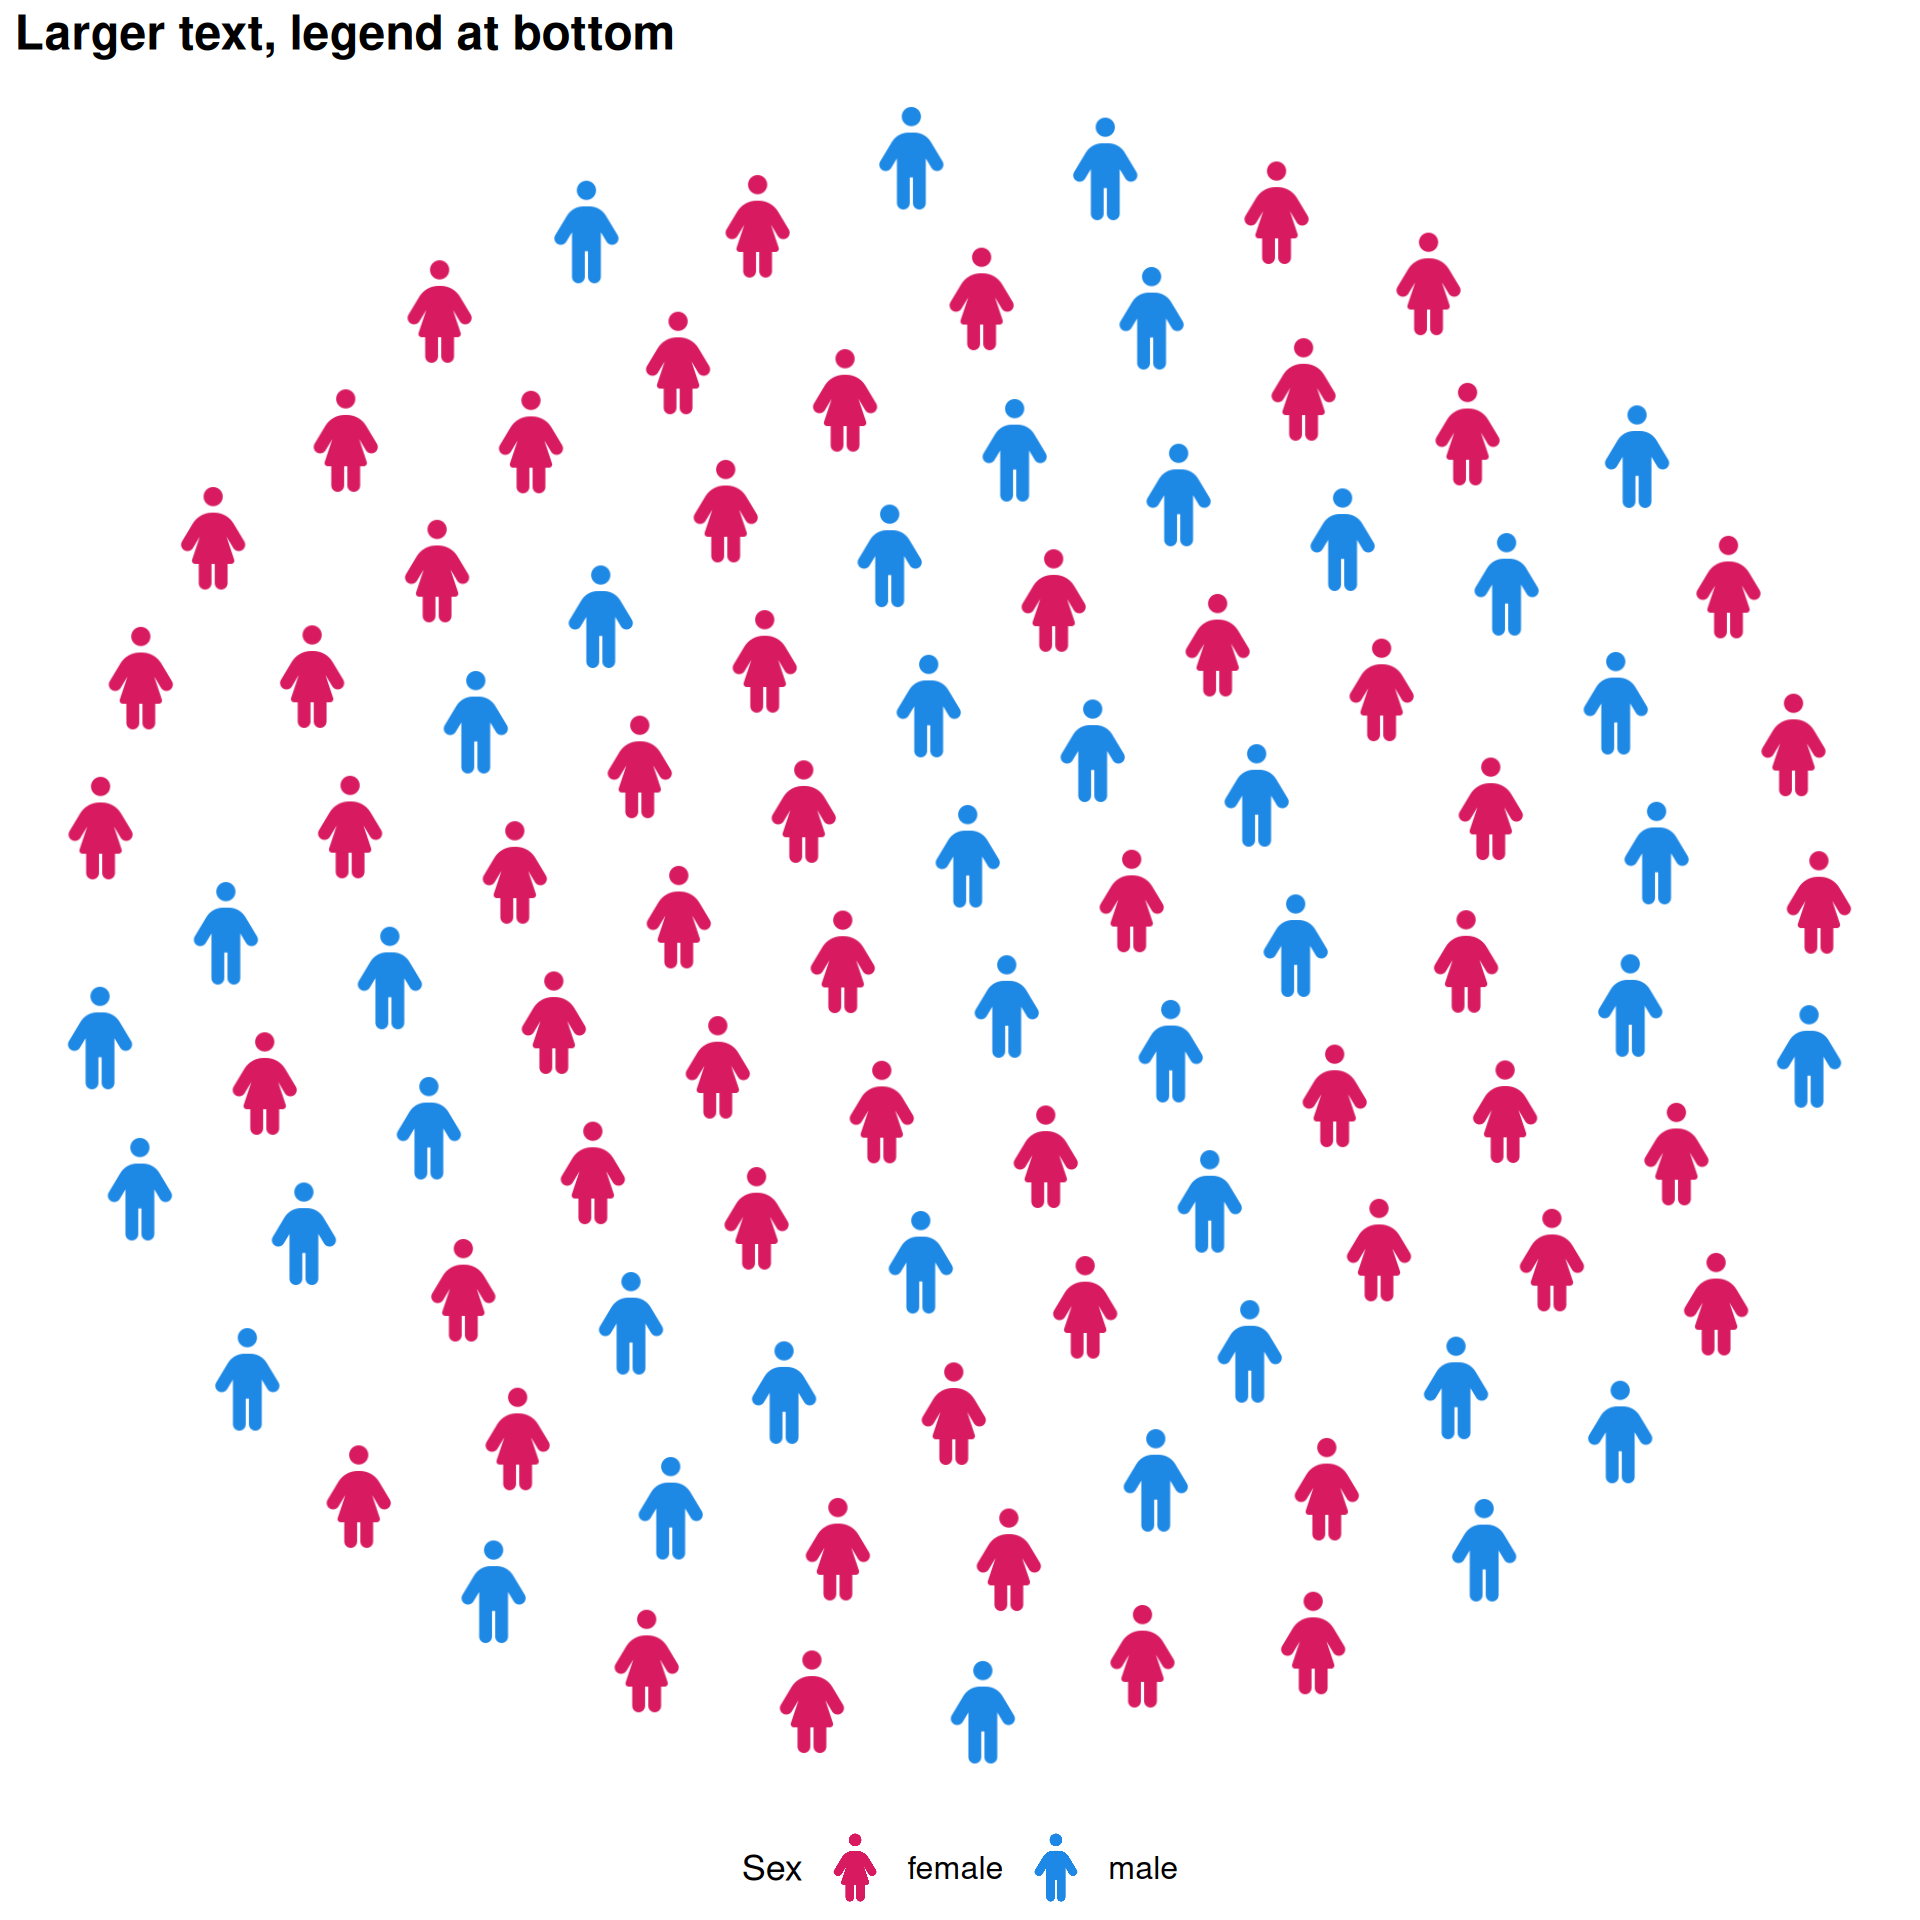
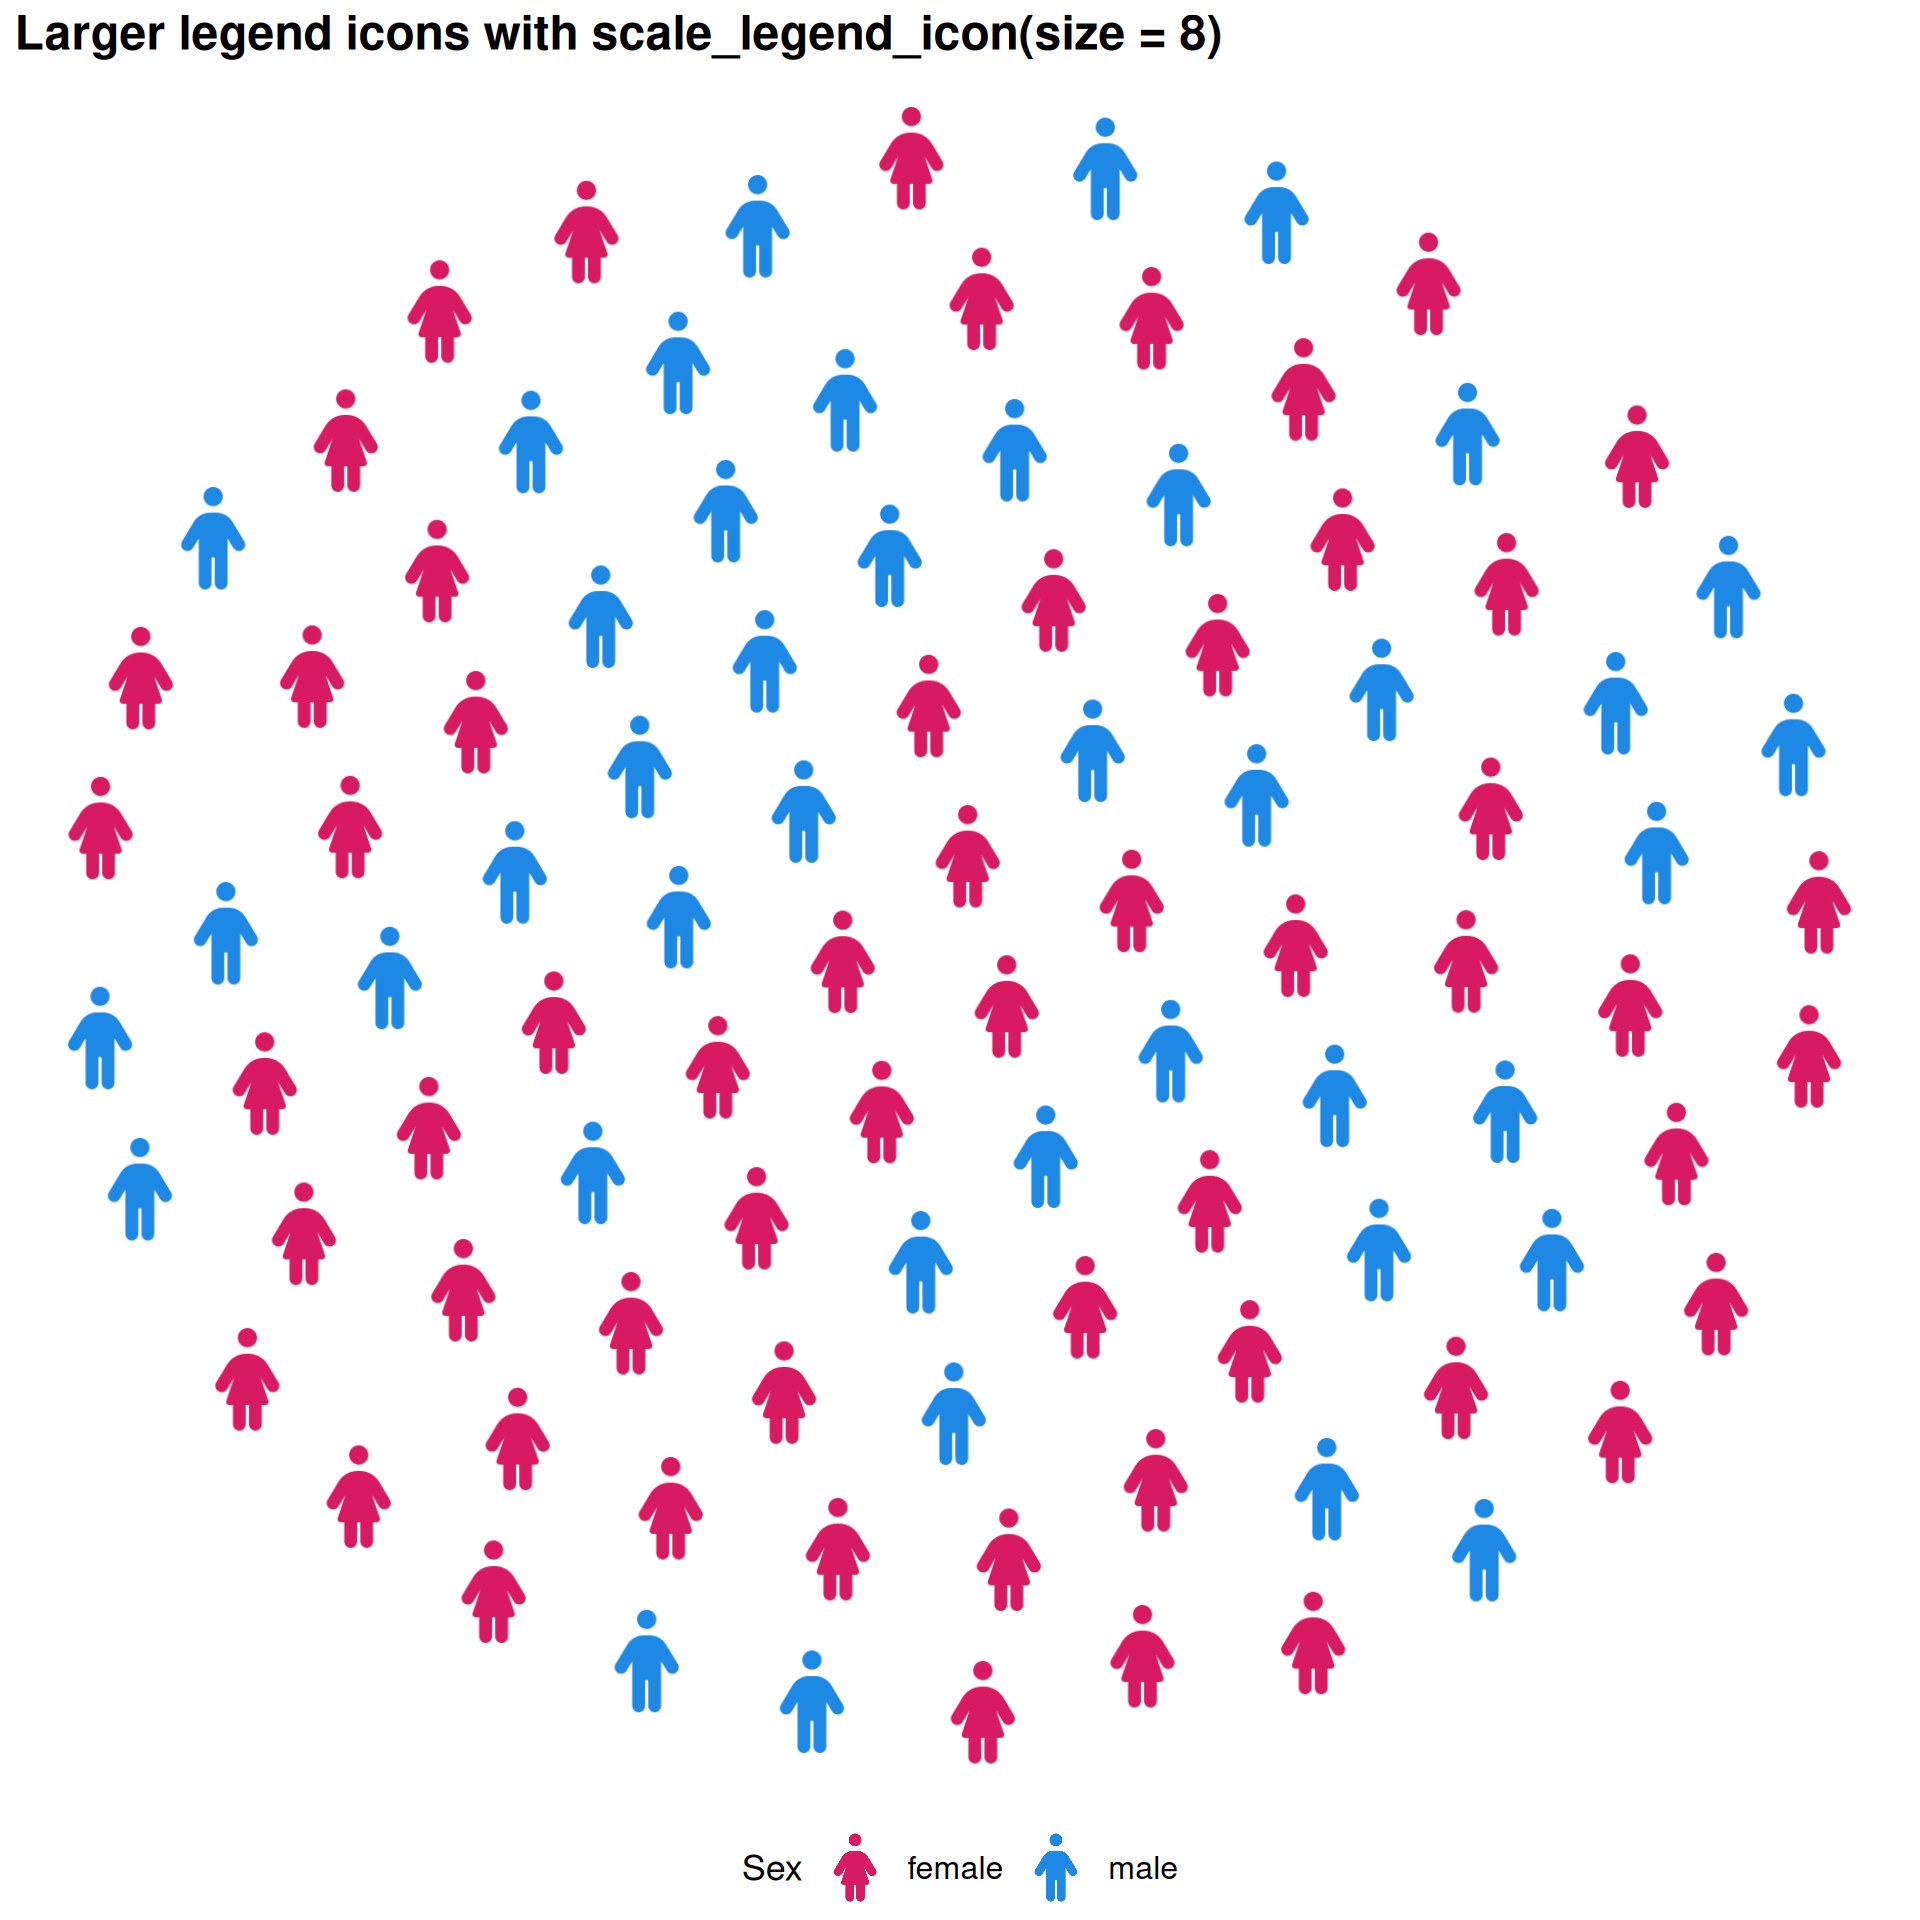
scale_legend_icon()
Controls legend icon size when legend_icons = TRUE.
ggplot() +
  geom_pop(
    data         = df_sex_proc,
    aes(icon = icon, color = type),
    size         = 2,
    dpi          = 100,
    legend_icons = TRUE
  ) +
  scale_color_manual(values = c("male" = "#1E88E5", "female" = "#D81B60")) +
  theme_pop(base_size = 15) +
  theme(legend.position = "bottom") +
  scale_legend_icon(size = 5) +
  labs(title = "Larger legend icons with scale_legend_icon(size = 8)", color = "Sex")
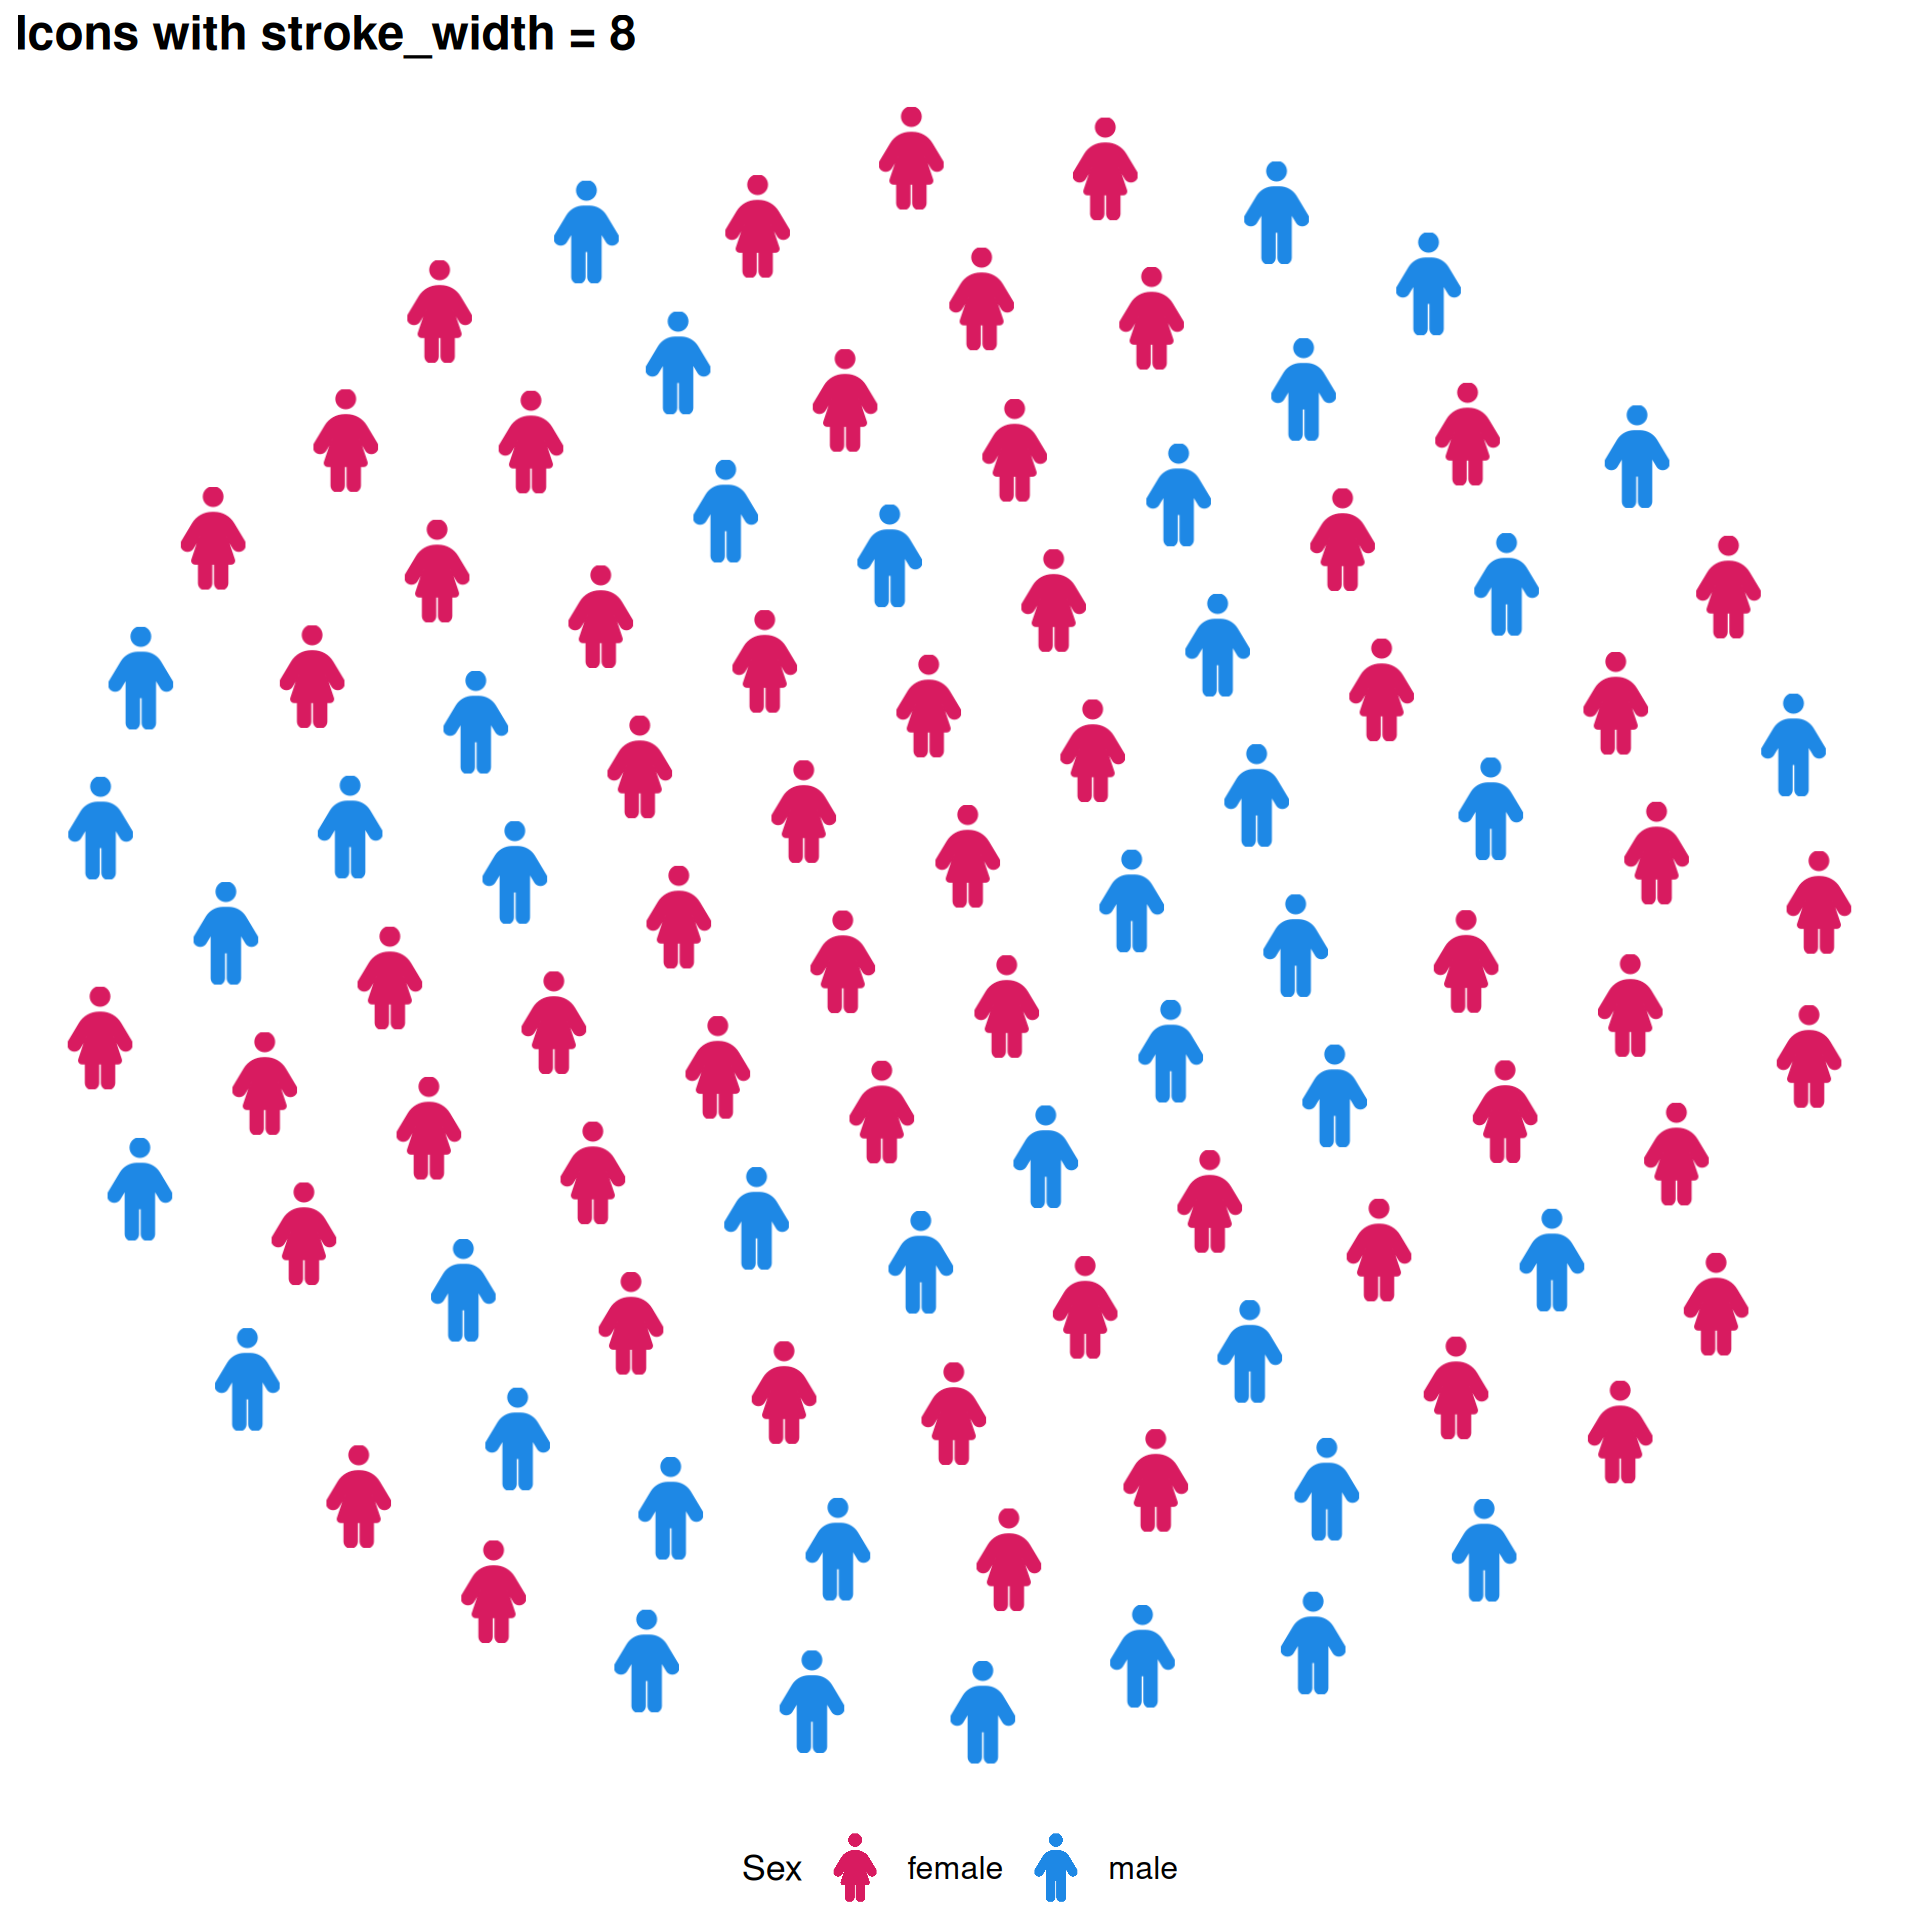
stroke_width — Icon Outlines
Add outlines to icons with stroke_width, useful for light icons on light backgrounds.
ggplot() +
  geom_pop(
    data         = df_sex_proc,
    aes(icon = icon, color = type),
    size         = 2,
    dpi          = 100,
    legend_icons = TRUE,
    stroke_width = 8
  ) +
  scale_color_manual(values = c("male" = "#1E88E5", "female" = "#D81B60")) +
  theme_pop(base_size = 15) +
  theme(legend.position = "bottom") +
  scale_legend_icon(size = 5) +
  labs(title = "Icons with stroke_width = 8", color = "Sex")
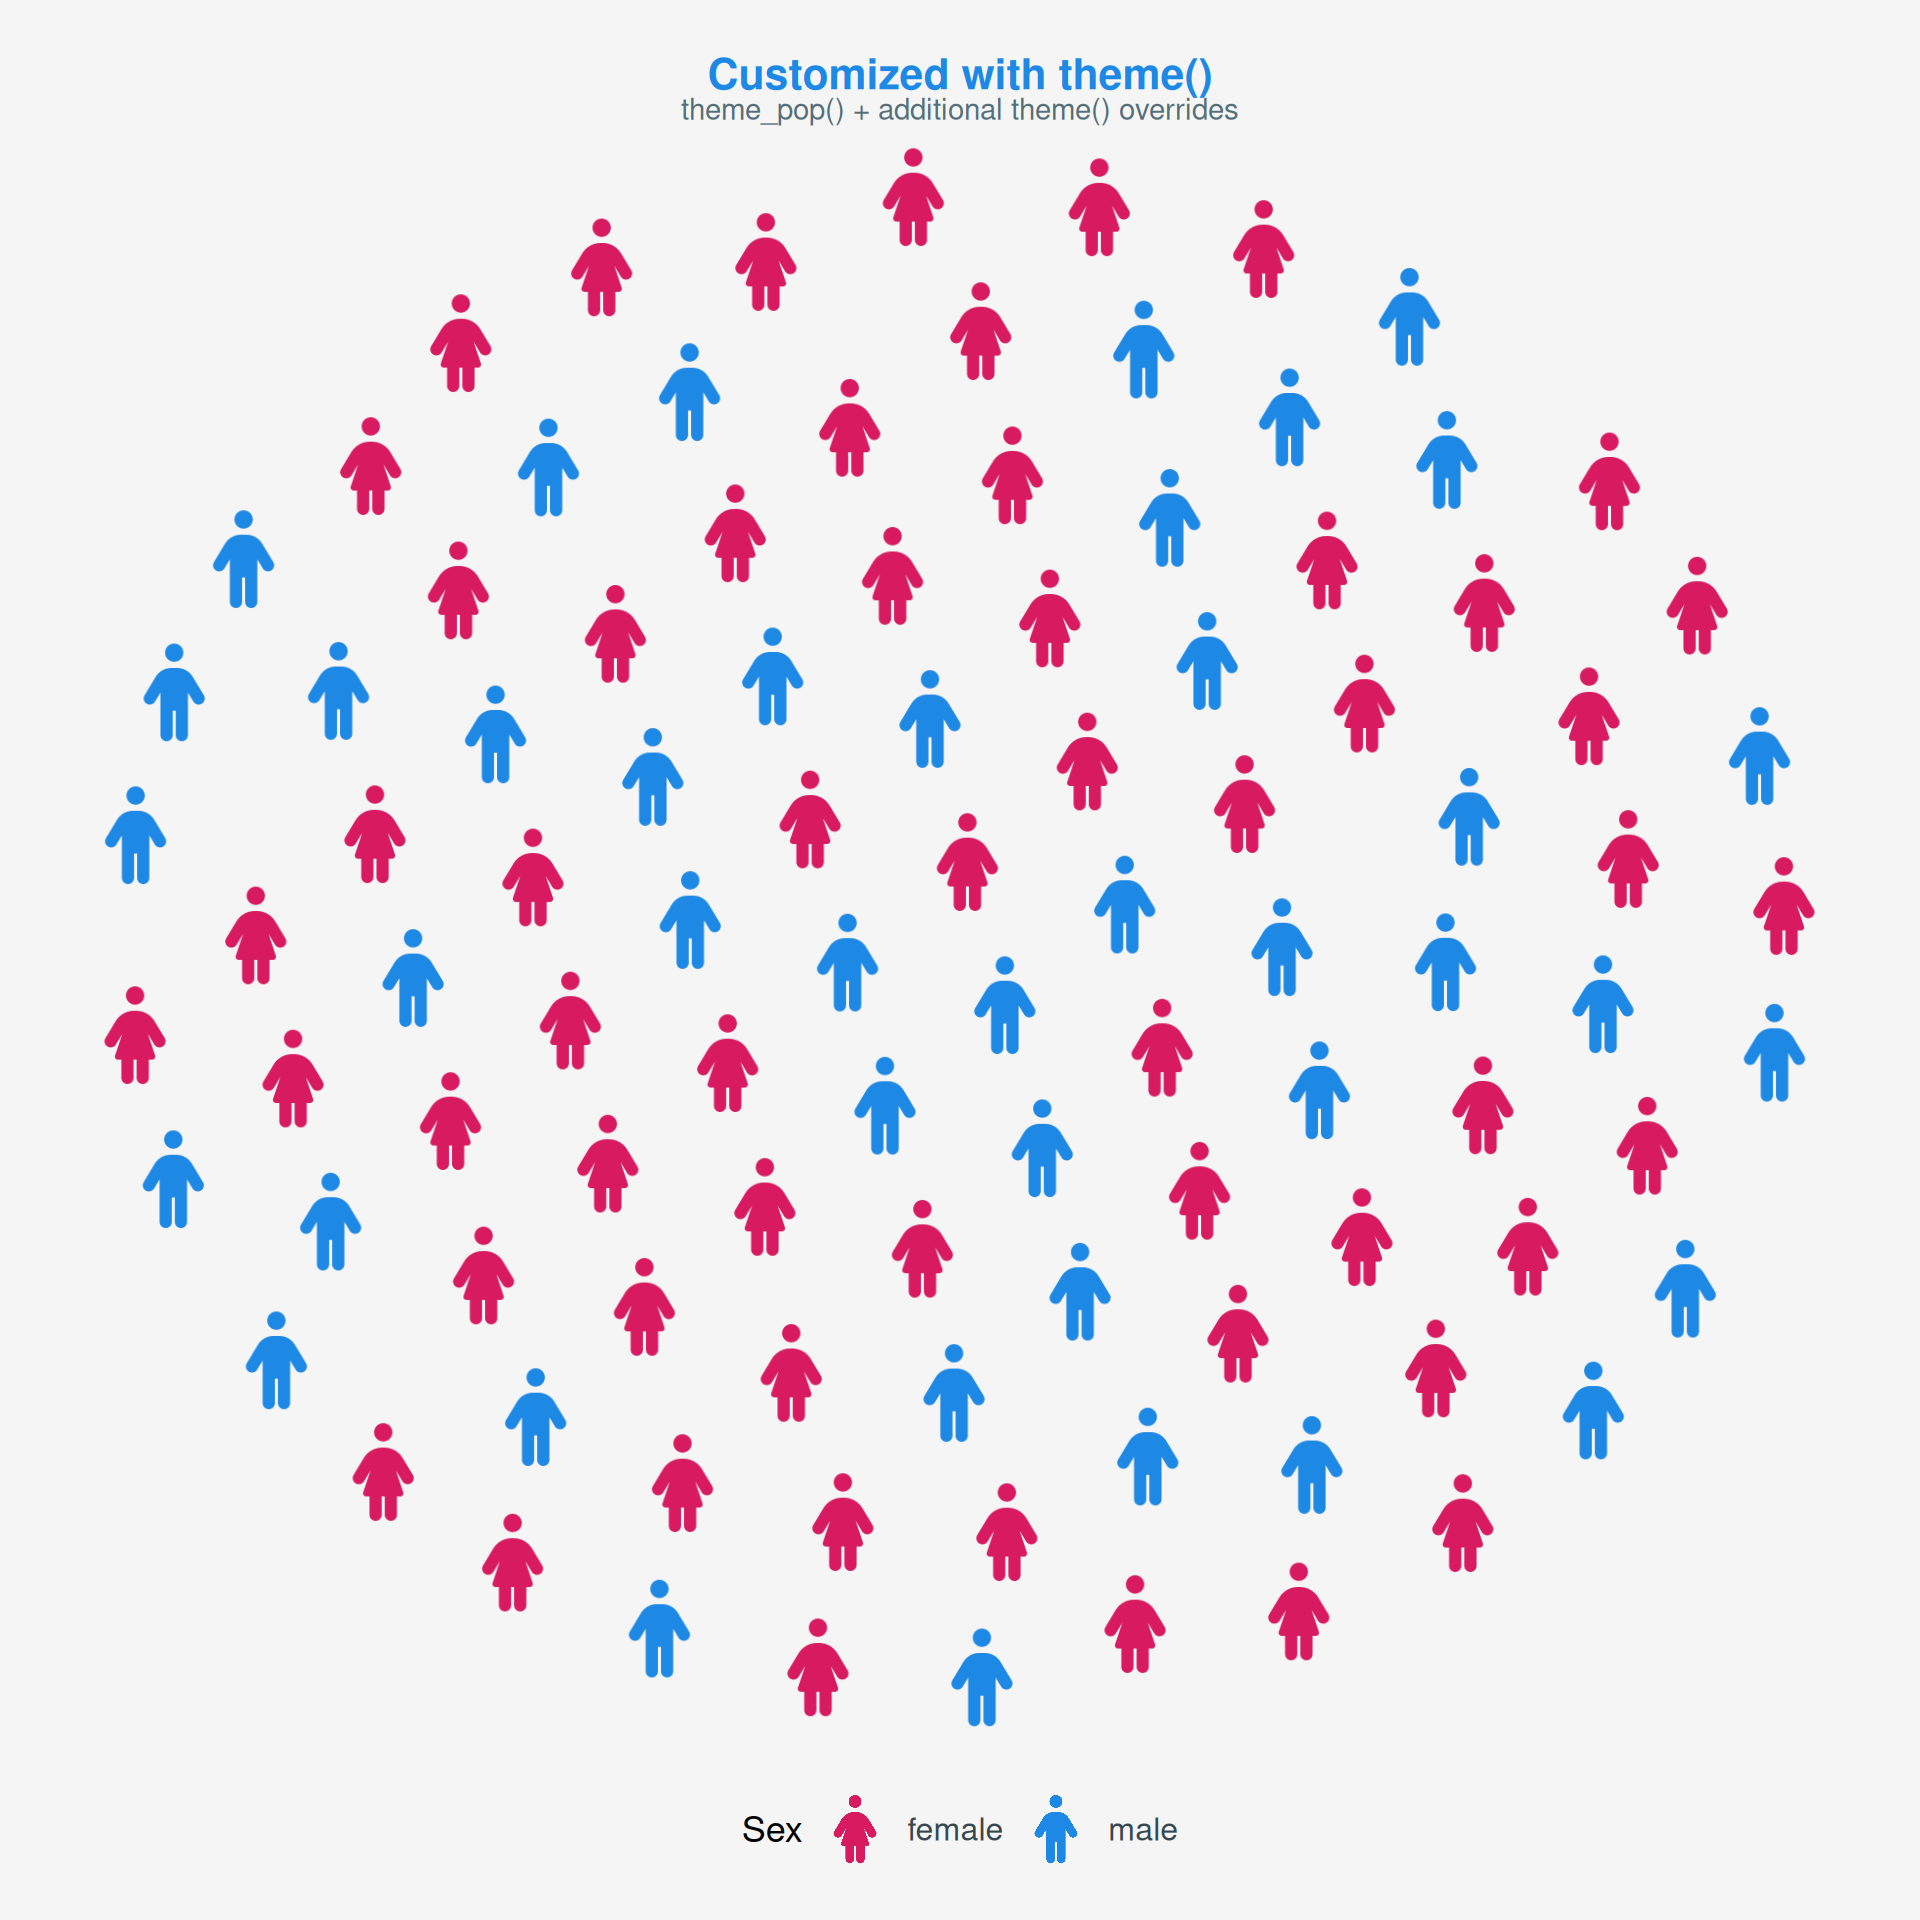
Combining with ggplot2 theme()
Layer theme() calls on top of any theme_pop*() to override specific elements.
ggplot() +
  geom_pop(
    data         = df_sex_proc,
    aes(icon = icon, color = type),
    size         = 2,
    dpi          = 100,
    legend_icons = TRUE
  ) +
  scale_color_manual(values = c("male" = "#1E88E5", "female" = "#D81B60")) +
  theme_pop_minimal(base_size=15) +
  theme(
    plot.background  = element_rect(fill = "#F5F5F5", color = NA),
    plot.title       = element_text(color = "#1E88E5", face = "bold", size = 16),
    plot.subtitle    = element_text(color = "#546E7A"),
    legend.text      = element_text(color = "#37474F"),
    legend.position = "bottom",
    plot.margin      = margin(20, 20, 20, 20)
  ) +
  scale_legend_icon(size = 5) +
  labs(
    title    = "Customized with theme()",
    subtitle = "theme_pop() + additional theme() overrides",
    color    = "Sex"
  )