Create a scatter plot with Font Awesome icons instead of points
Source:R/geom_icon_point.R
geom_icon_point.RdWorks exactly like geom_point(), but renders Font Awesome icons instead of dots. Pass any data with x and y variables - no special formatting required.
Usage
geom_icon_point(
  mapping = NULL,
  data = NULL,
  stat = "identity",
  position = "identity",
  na.rm = FALSE,
  show.legend = NA,
  inherit.aes = TRUE,
  icon = NULL,
  size = 1,
  dpi = 50,
  legend_icons = TRUE,
  stroke_width = NULL,
  icon_path = NULL,
  ...
)
Arguments
- mapping
Set of aesthetic mappings created by
aes(). If specified andinherit.aes = TRUE(the default), it is combined with the default mapping at the top level of the plot. You must supplymappingif there is no plot mapping.- data
The data to be displayed in this layer. There are three options:
If
NULL, the default, the data is inherited from the plot data as specified in the call toggplot().A
data.frame, or other object, will override the plot data. All objects will be fortified to produce a data frame. Seefortify()for which variables will be created.A
functionwill be called with a single argument, the plot data. The return value must be adata.frame, and will be used as the layer data. Afunctioncan be created from aformula(e.g.~ head(.x, 10)).- stat
The statistical transformation to use on the data for this layer. When using a
geom_*()function to construct a layer, thestatargument can be used to override the default coupling between geoms and stats. Thestatargument accepts the following:A
Statggproto subclass, for exampleStatCount.A string naming the stat. To give the stat as a string, strip the function name of the
stat_prefix. For example, to usestat_count(), give the stat as"count".For more information and other ways to specify the stat, see the layer stat documentation.
- position
A position adjustment to use on the data for this layer. This can be used in various ways, including to prevent overplotting and improving the display. The
positionargument accepts the following:The result of calling a position function, such as
position_jitter(). This method allows for passing extra arguments to the position.A string naming the position adjustment. To give the position as a string, strip the function name of the
position_prefix. For example, to useposition_jitter(), give the position as"jitter".For more information and other ways to specify the position, see the layer position documentation.
- na.rm
logical, whether remove NA values
- show.legend
Logical. Should this layer be included in the legends?
NA(default) includes the layer if any aesthetics are mapped.FALSEsuppresses the layer's legend entries entirely.- inherit.aes
If
FALSE, overrides the default aesthetics, rather than combining with them. This is most useful for helper functions that define both data and aesthetics and shouldn't inherit behaviour from the default plot specification, e.g.annotation_borders().- icon
Default icon (default: NULL). Accepts a Font Awesome name, a bundled ggpop marker name (e.g.
"square-inset","circle-plus","diamond-hollow"), or a path to a local.svgfile. The same sources are valid inaes(icon = ...); SVG markers are recoloured by the mapped colour aesthetic.- size
Default icon size (default: 1).
- dpi
Icon resolution (default: 50).
- legend_icons
Show icons in legend (default: TRUE).
- stroke_width
Numeric. Width of the icon outline/stroke.
- icon_path
Optional path to a folder of your own SVG icons, referenced by file name (without
.svg) through theiconaesthetic - just like a Font Awesome name. Defaults togetOption("ggpop.icon_path"). Monochrome SVGs (fill="#000000"orcurrentColor) are recoloured by the mapped colour. Seeggpop_markers.- ...
additional parameters
Aesthetics
geom_icon_point uses standard ggplot2 scatter plot aesthetics:
x - Numeric variable for x-axis
y - Numeric variable for y-axis
icon - Font Awesome icon name (optional, column or mapped)
color/colour - Color grouping
alpha - Transparency
size - Icon size
Examples
# \donttest{
library(ggplot2)
data <- data.frame(
x = rnorm(20),
y = rnorm(20),
category = sample(c("A", "B", "C"), 20, replace = TRUE),
icon = sample(c("heart", "star", "circle"), 20, replace = TRUE)
)
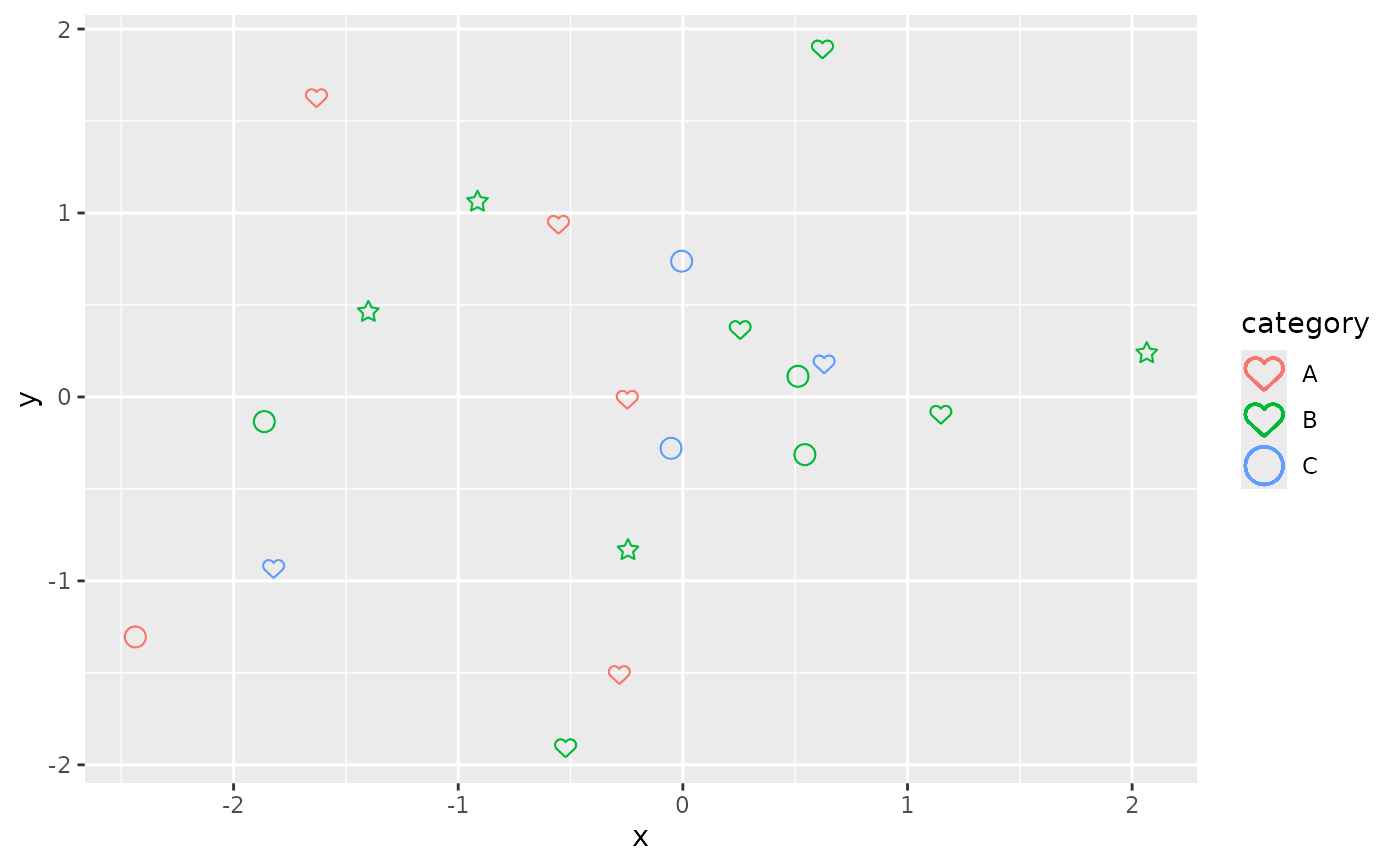
# Map icon to a column
ggplot(data, aes(x = x, y = y, icon = icon, color = category)) +
geom_icon_point()
#> Warning: Multiple icons per color/group detected.
#>
#> ! Why you are seeing this warning:
#> The legend can only display ONE icon per group, but some groups have
#> multiple:
#>
#> - A: 2 icons (circle, heart)
#> - B: 3 icons (star, heart, circle)
#> - C: 2 icons (circle, heart)
#>
#> ℹ What happens:
#> - The most frequent icon for each group will be shown in the legend
#> - Other icons in that group will still appear in the plot
#> - This may confuse viewers if icons have different meanings
#>
#> ℹ Recommended fixes:
#>
#> Option 1: Use consistent icons per group
#> `df <- df %>% mutate(icon = case_when(`
#> `sex == 'A' ~ 'male',`
#> `sex == 'B' ~ 'female'`
#> `))`
#>
#> Option 2: Create a separate grouping variable
#> `df <- df %>% mutate(group = paste(sex, icon, sep = '_'))`
#> `ggplot() + geom_pop(aes(icon = icon, color = group))`
#>
#> Option 3: Set legend_icons = FALSE to use point markers
#> `geom_pop(..., legend_icons = FALSE)`
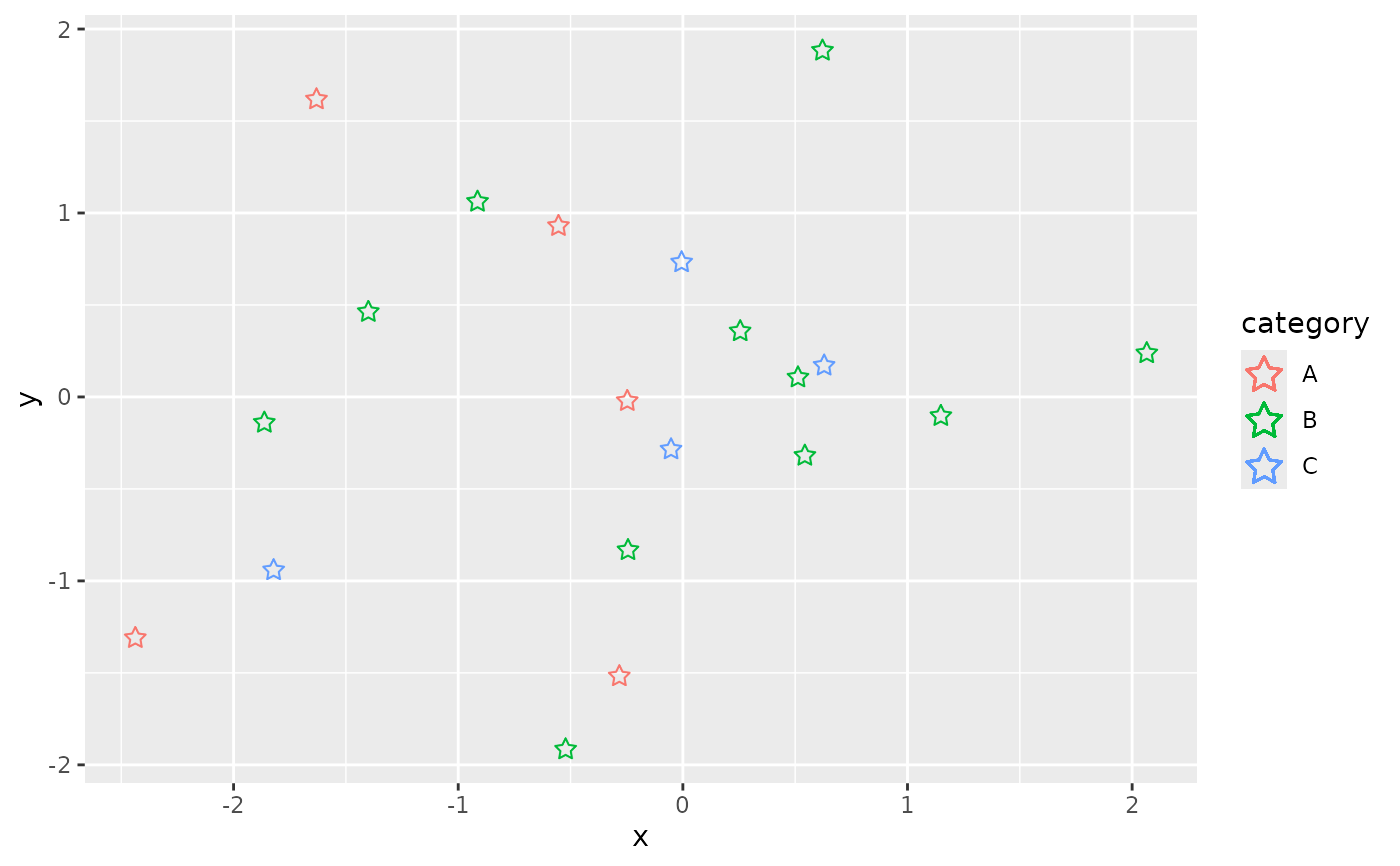
 # Use a fixed icon
ggplot(data, aes(x = x, y = y, color = category)) +
geom_icon_point(icon = "star")
# Use a fixed icon
ggplot(data, aes(x = x, y = y, color = category)) +
geom_icon_point(icon = "star")
 # }
# }