
For an ordinary legend keyed to your plot data you do not need this
function - map an aesthetic and let ggplot2 build the legend natively:
geom_icon_point(..., legend_icons = TRUE) + scale_legend_icon().
Use marker_legend() only for a standalone composite legend that
ggplot2's guide system cannot express - a multi-column grouped legend
decoupled from any plot, often combined with extra annotations and exported
at fixed pixel dimensions (for example the screening-strategy
Legend_*.png figures).
Usage
marker_legend(
  entries,
  layout = c("column", "grid"),
  ncol = 1,
  title = NULL,
  marker_size = 3,
  label_size = 2.8,
  dpi = 300,
  icon_path = NULL,
  col_spacing = 10,
  row_spacing = 1,
  label_gap = 0.6,
  label_colour = "black",
  label_fontface = "plain",
  default_color = "black"
)
Arguments
- entries
A data frame of legend rows. Must contain an
iconcolumn (icon source per row) and alabelcolumn (text shown beside the marker). An optionalcolour(orcolor) column sets the marker colour per row as a literal value. Forlayout = "grid"the data frame must also contain integerrowandcolcolumns.- layout
Legend arrangement.
"column"(default) auto-arranges the rows intoncolcolumns, filling each column top to bottom."grid"places each entry at its explicitrow/colcell.- ncol
Number of columns for
layout = "column". Ignored when an explicitcolumnfield is supplied inentries.- title
Optional bold title drawn centred above the legend.
- marker_size
Icon size passed to
geom_icon_point.- label_size
Text size for the labels.
- dpi
Icon rendering resolution passed to
geom_icon_point.- icon_path
Optional folder of user
.svgmarkers, referenced by bare name in theiconcolumn. Seegeom_icon_point.- col_spacing
Horizontal distance between columns.
- row_spacing
Vertical distance between rows.
- label_gap
Horizontal gap between a marker and its label.
- label_colour
Text colour for the labels (default:
"black").- label_fontface
Font face for the labels (default:
"plain"). Common values:"plain","bold","italic".- default_color
Marker colour used for rows with no
colourvalue.
Value
A ggplot object with theme_void() applied.
Details
Lays out icon + label entries into a self-contained ggplot object.
Each entry is drawn with geom_icon_point, so any icon source is
accepted - Font Awesome names, bundled ggpop markers, or user-supplied
.svg paths (see ggpop_markers) - and the three may be
mixed in a single legend. The result is a plain ggplot you can extend
with further ggplot2::annotate() layers (frontier segments, colour
bands, asterisks) and export at any size with ggplot2::ggsave().
Examples
# \donttest{
# For a normal data-driven legend, prefer the native path instead:
# geom_icon_point(aes(icon = icon, colour = group), legend_icons = TRUE) +
# scale_legend_icon()
# marker_legend() is for a STANDALONE composite legend - here two semantic
# colour-columns, the kind ggplot2 guides cannot produce in one figure.
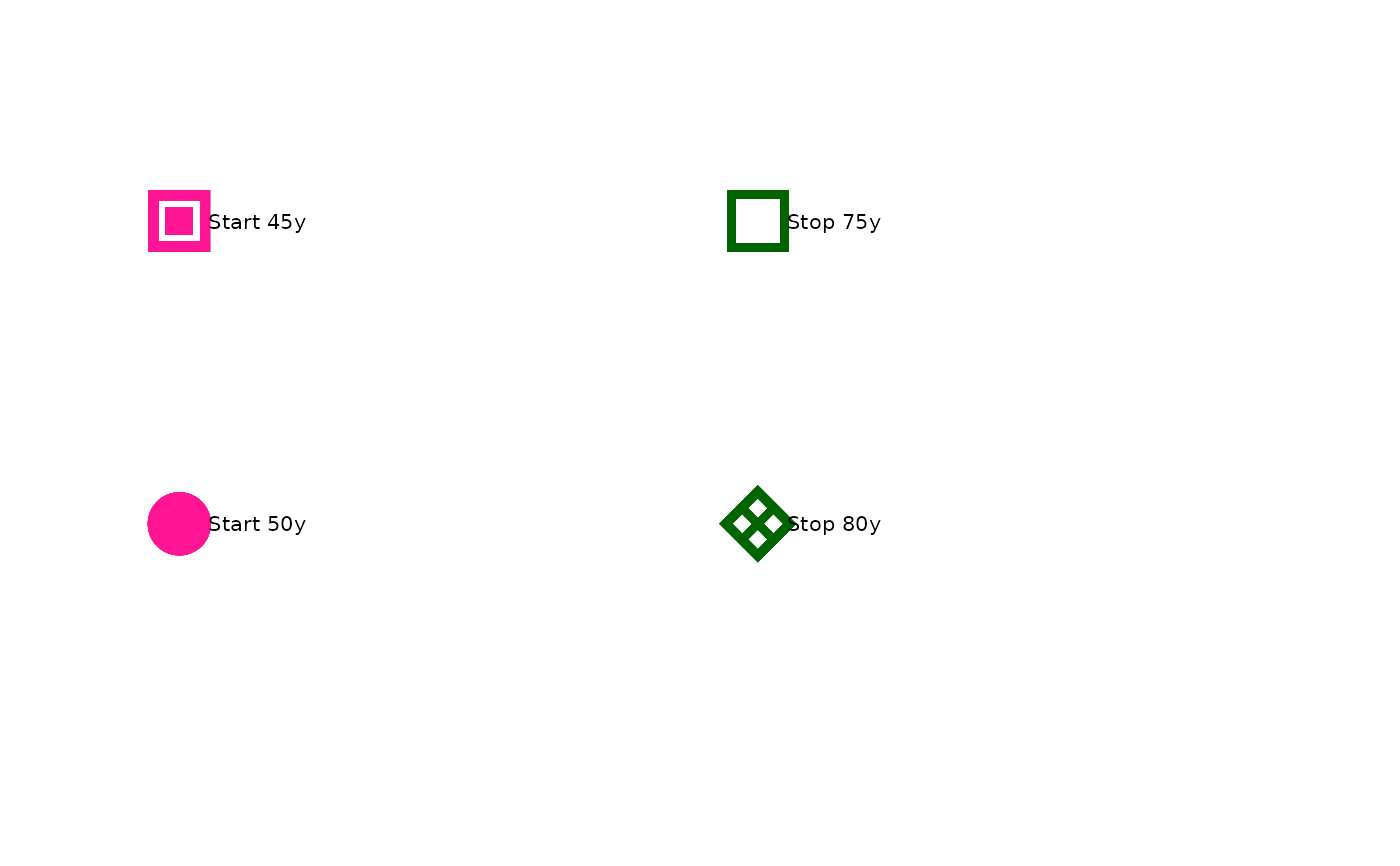
df_legend <- data.frame(
column = c(1, 1, 2, 2),
icon = c("square-inset", "circle-solid", "square-hollow", "diamond-cross"),
label = c("Start 45y", "Start 50y", "Stop 75y", "Stop 80y"),
colour = c("#FF1493", "#FF1493", "#006400", "#006400"),
stringsAsFactors = FALSE
)
marker_legend(df_legend, col_spacing = 12)
 # }
# }